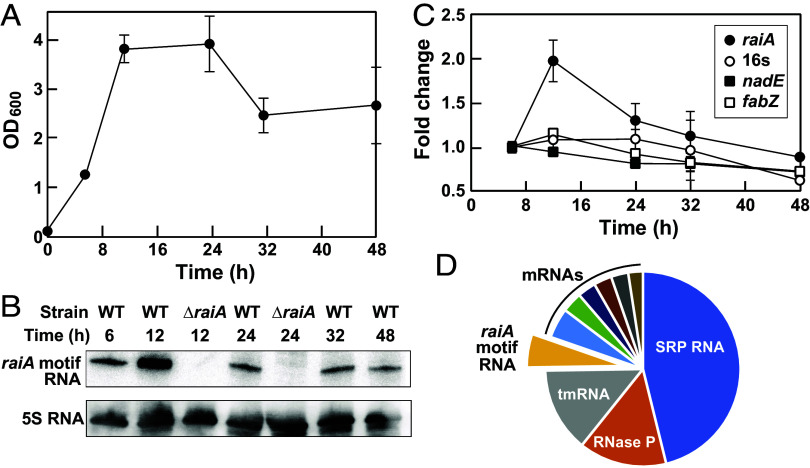
Fig. 4.
Detection and quantitation of the raiA motif RNA transcript. (A) Growth curve for C. acetobutylicum under anaerobic conditions in 2× YTG medium (48). (B) Northern blot analysis of raiA motif RNAs from WT and ΔraiA motif strains of C. acetobutylicum. 5S rRNA is used as a loading control. (C) Plot of the quantitation of raiA motif RNA levels from WT C. acetobutylicum at various time points using qPCR. Controls include 16S RNA, nadE mRNA, and fabZ mRNA. Fold change values were established relative to the ct numbers obtained at 6 h, which were set to 1. (D) Pie chart of the relative abundances of the top 10 RNA transcripts in WT C. acetobutylicum cells upon exclusion of tRNAs and rRNAs, as determined by analysis of whole-transcriptome sequencing (RNAseq) data published previously (49).

