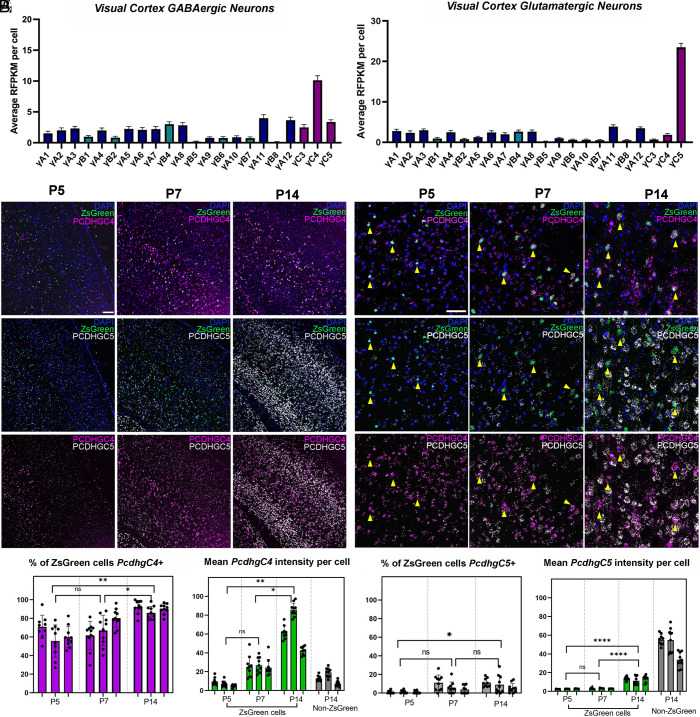
Fig. 1.
Divergent expression of PcdhγC4 and PcdhγC5 in cINs and excitatory cortical neurons during PCD. (A and B) ScRNA-seq analysis from publicly available datasets (37, 38) shows high expression of PcdhγC4 in GABAergic cINs (A) and low expression in excitatory GLUTamatergic neurons (B). In contrast, PcdhγC5 is expressed high in excitatory neurons (B) and low in cINs (A). Error bars represent the SEM. (C and D) RNAscope of visual cortex in Nkx2.1; Ai6 mice during PCD. Low (C) and high magnification (D) images show low expression of PcdhγC4 and PcdhγC5 at P5. Between P7 and P14, expression of both PcdhγC4 and PcdhγC5 has noticeably increased. By P7 and P14, PcdhγC4 is highly and preferentially expressed in ZsGreen+ MGE-derived cINs (yellow arrows), while PcdhγC5 is preferentially present in ZsGreen− cells. Scale bar low-magnification (C) = 100 μm. Scale bar high-magnification (D) = 50 μm. (E and F) Quantification of PcdhγC4 isoform transcripts in the visual cortex of P5–P14 mice (E). Measurements of the average mean signal intensity of PcdhγC4 in ZsGreen+ MGE-derived cINs showing PcdhγC4 signal increases significantly between P5 and P14, while expression of PcdhγC4 in ZsGreen negative cells remains comparably low (F). n = 3 animals per genotype, 9 to 10 fields per animal, quantified at least 25 cells per field. Nested 1-way ANOVA with Tukey’s multiple comparisons test; *P <0.05, **P < 0.01, ***P < 0.005, and ****P < 0.0001; ns = not significant. (G and H) Quantification of PcdhγC5 isoform transcripts in the visual cortex of P5–P14 mice. Proportions of MGE-derived cINs that express PcdhγC5 remained low during the period of PCD; 0.9% at P5, 6.8% at P7, and 8.5% at P14 (G). The average mean signal intensity of PcdhγC5 transcript in MGE-derived cINs was low throughout PCD, while non-MGE (ZsGreen−) derived cINs showed high PcdhγC5 signal at P14 (H). n = 3 animals per genotype, 9 to 10 fields per animal, quantified at least 25 cells per field. Nested 1-way ANOVA with Tukey’s multiple comparisons test; *P < 0.05, **P < 0.01, ***P < 0.005, and ****P < 0.0001; ns = not significant.

