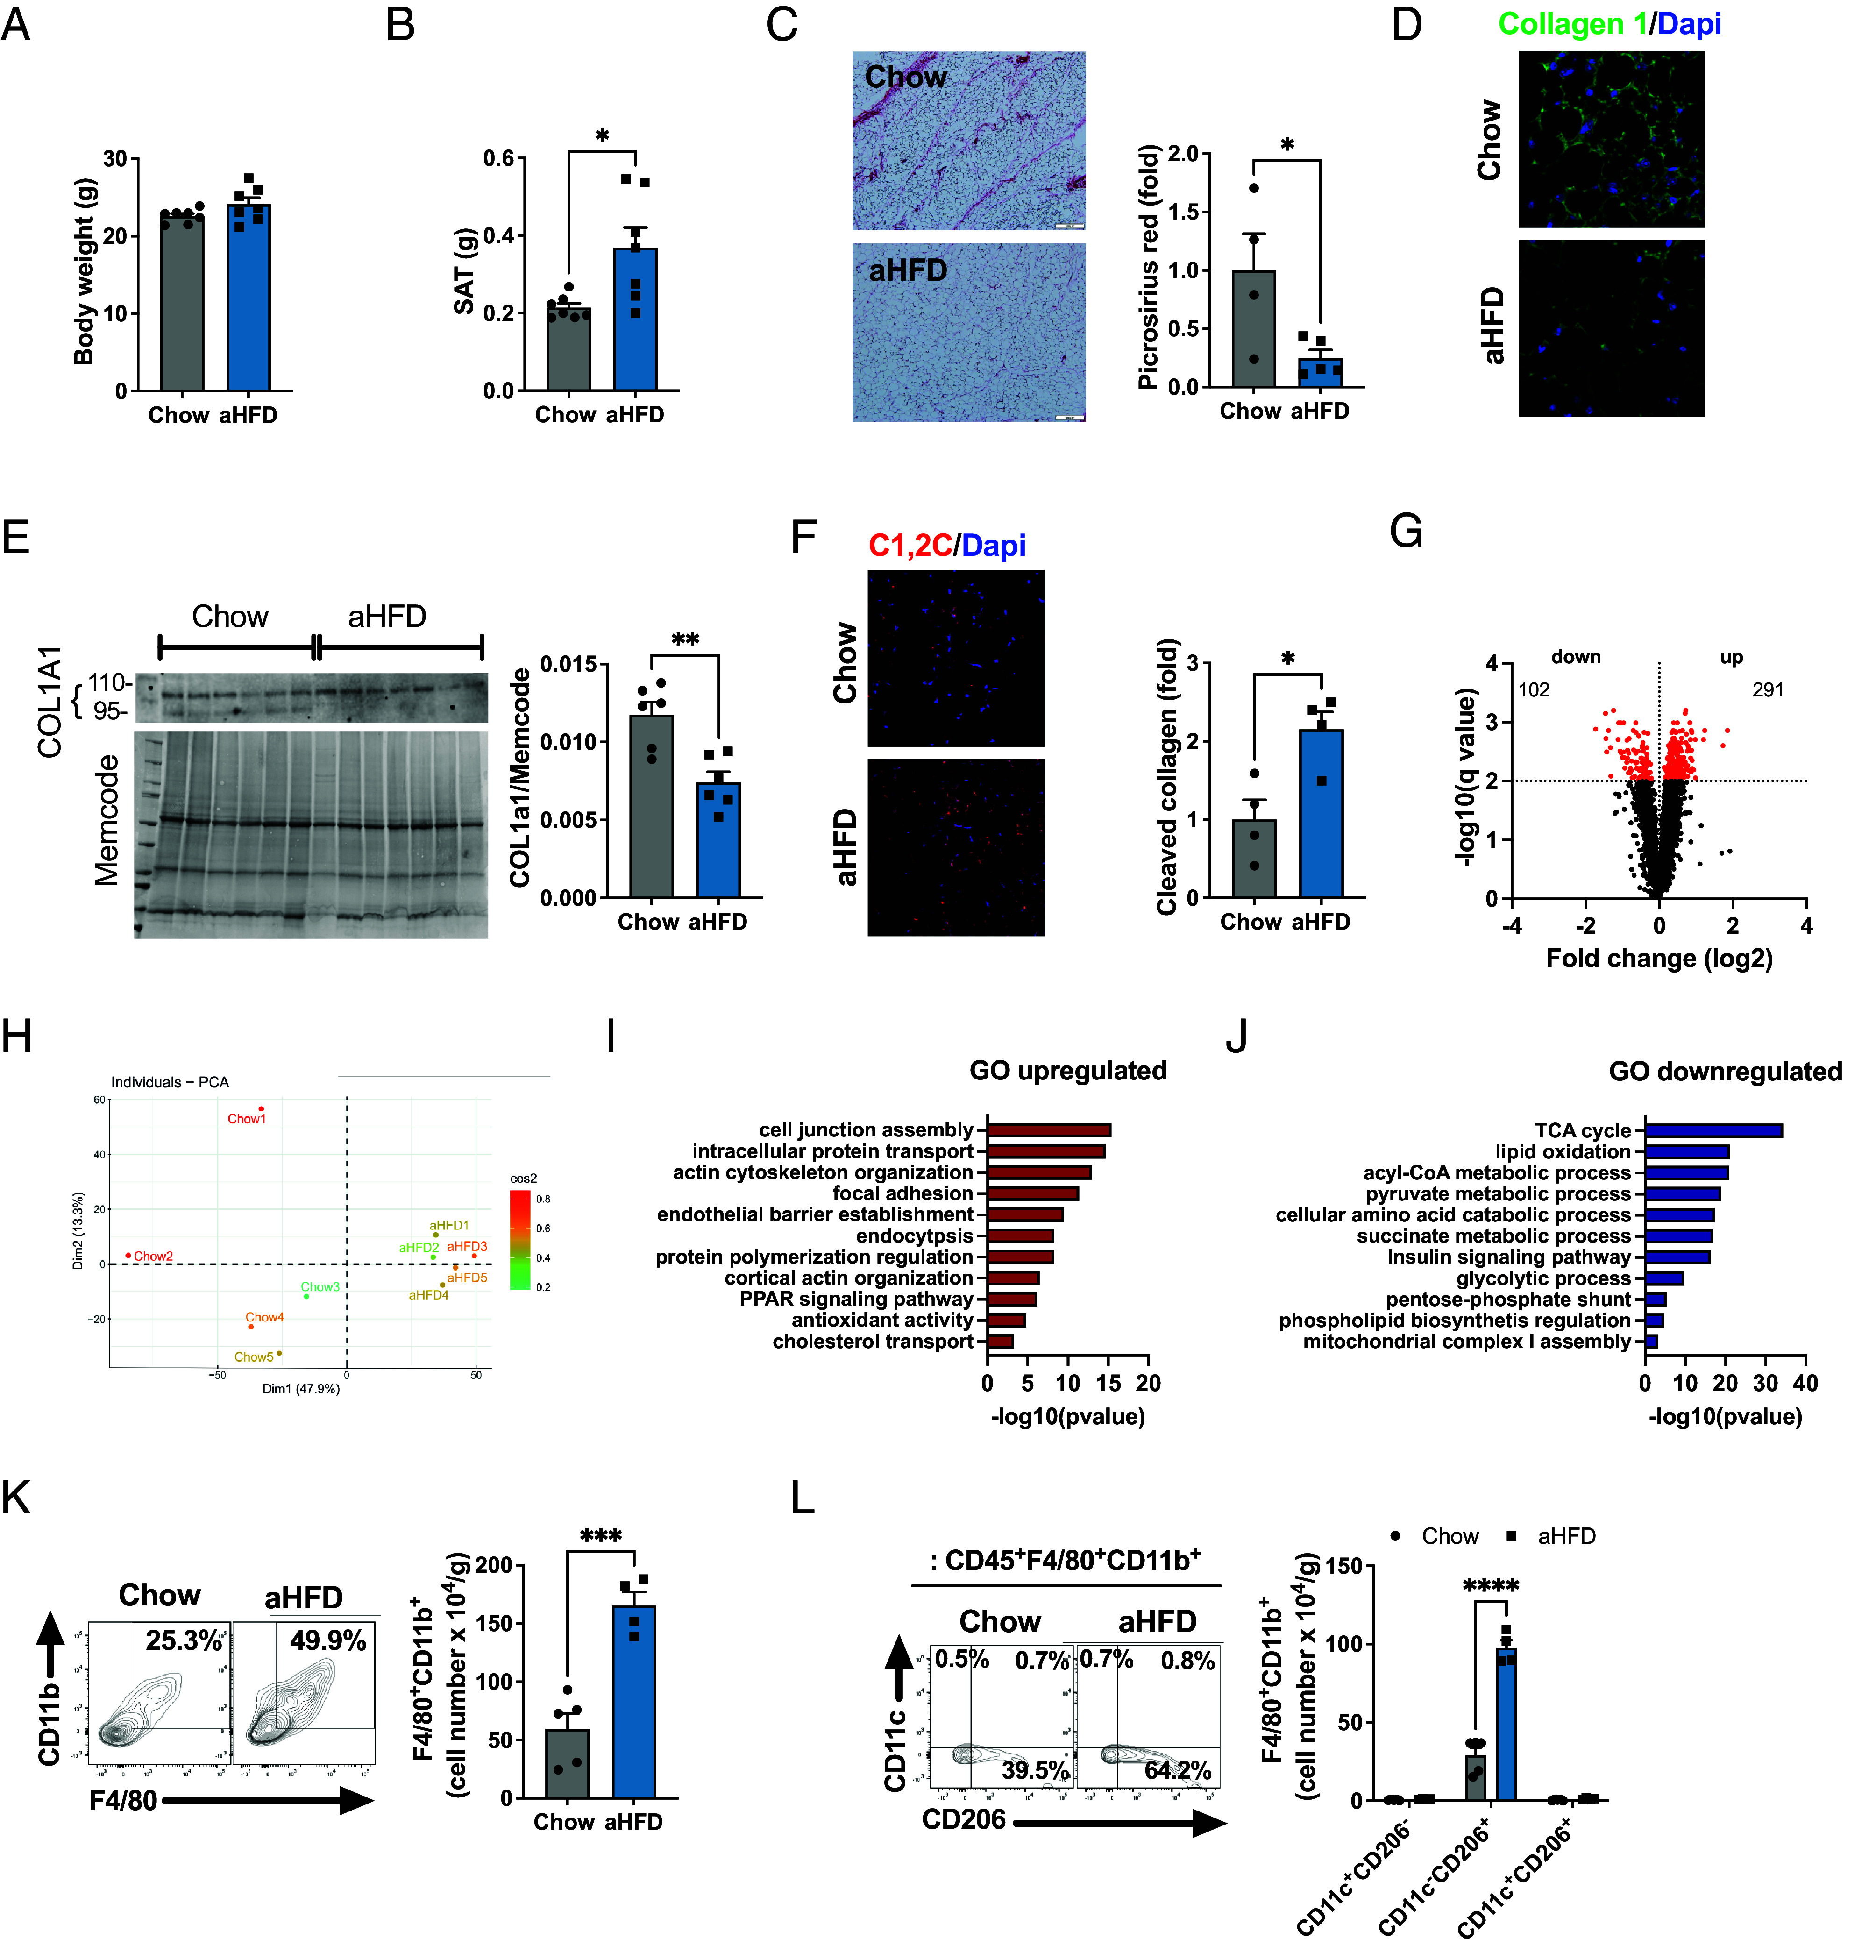
Fig. 1.

Acute challenge with 1-wk HFD leads to SAT CT1 degradation and accumulation of M2-like macrophages. (A) Body and (B) SAT weight of 8 wk old male C57BL/6N chow and aHFD mice (n = 7/group). (C) Representative image and quantification of picrosirius red staining on SAT of chow (n = 4) and aHFD mice (n = 5). For each animal, images were collected from more than six random fields. Data are presented as fold change compared to chow mice (scale bar, 100 µm). (D) Representative image of immunohistofluorescent CT1 staining (green) in SAT of chow and aHFD mice. Nuclei were stained with Dapi (blue, scale bar, 20 µm). (E) Western blot analysis of COL1A1 in SAT of chow and aHFD mice (n = 4/group). Band intensity was normalized to total protein amount on the membrane. (F) Representative image and quantification of cleaved CT1 in SAT of chow and aHFD mice (n = 4/group). Cleaved CT1 was stained with C1,2C antibody (red) and nuclei were stained with Dapi (blue, scale bar, 20 µm). For each group, tiled (5 x 5) images were taken from at least 3 random fields. Data are presented as fold change compared to control mice. (G) Volcano plot and (H) PCA of differentially abundant proteins in SAT of chow and aHFD mice (n = 5/group), detected and quantified by LC-MS/MS using TMT multiplexing. Pathway enrichment analysis of (I) up-regulated and (J) down-regulated proteins in SAT of aHFD mice relative to chow controls. Analysis was done in Cytoscape with GO:Biological process database. (K) Representative dot plot and number of macrophages (single live CD45+F4/80+CD11b+) per gram of SAT from chow (n = 5) and aHFD (n = 4) mice. (L) Representative dot plot and number of macrophage (single live CD45+F4/80+CD11b+) subsets (M1-like=CD11c+CD206−, M2-like=CD11c−CD206+ and mixed M1-M2=CD11c+CD206+) per gram of SAT from chow (n = 5) and aHFD (n = 4) mice. Data are presented as mean ± SEM. Data are representative of at least three independent experiments (A–F, K, and L). Unpaired student’s t tests (A, B, G, I, J, and K), 2-way ANOVA with Fisher’s post hoc test (L). Multiple unpaired t test with Welch correction, corrected with false discovery rate set to 1% cut-off (q value above 2 is significant). *P < 0.05, ***P < 0.001.
