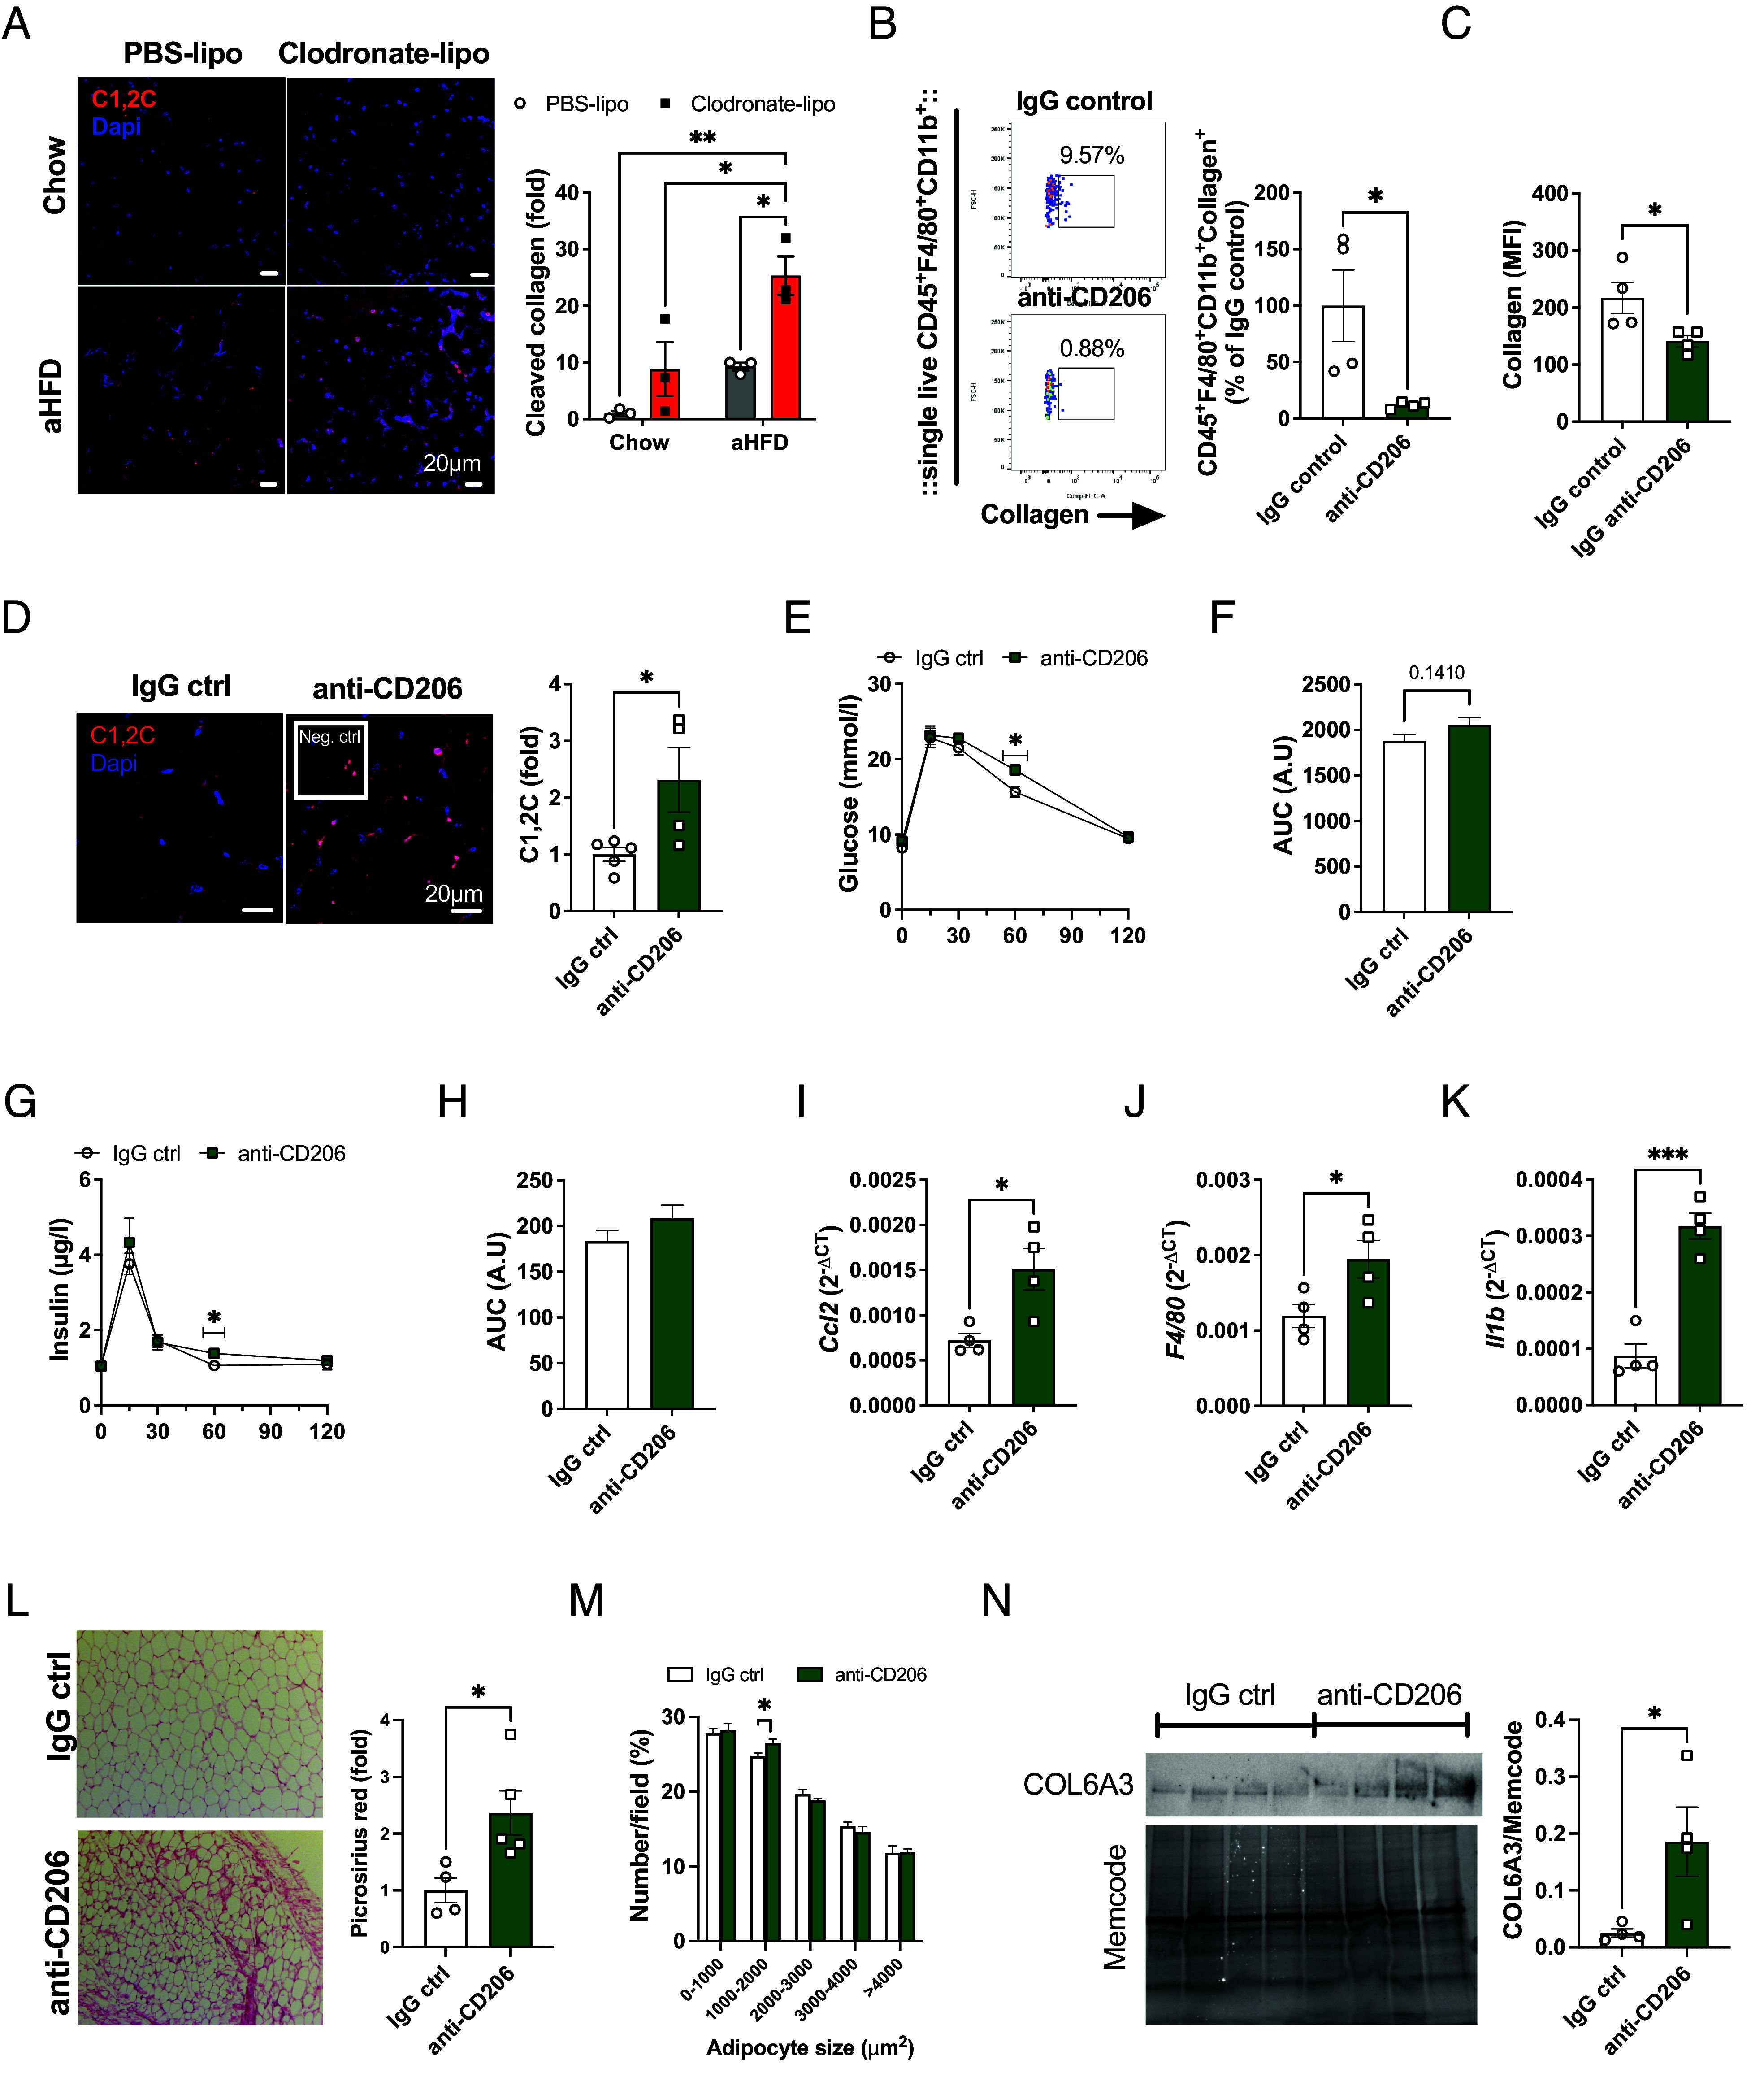
Fig. 3.

CT1 endocytosis in SAT macrophages is mediated by CD206 receptor. (A) Representative images and quantification of C1,2C staining in SAT. Chow and aHFD mice received Clodronate-liposomes (40 mg/kg bw) into one SAT fat pad and control PBS-liposomes into another fat pad on day 0 and day 3 of aHFD course (n = 3/group). Cleaved CT1 was stained with C1, 2C antibody (red) and nuclei were stained with Dapi (blue, scale bar, 20 µm). For each group, tiled (5 x 5) images were taken from at least three random fields. Data are presented as fold change compared to chow PBS SAT. (B and C) Representative dot plots and quantification of ex vivo collagen endocytosis assay in the presence of neutralizing anti-CD206 antibody or IgG control (n = 4/group). SAT-macrophages from lean mice were magnetically sorted (F4/80+) and treated with FITC-collagen (15 µg/mL) in the presence of anti-CD206 antibody or IgG control (10 µg/mL). Collagen+ macrophages as (B) % of total macrophages and (C) collagen uptake per cell, measured as MFI values. (D–N) In vivo antibody-mediated CD206 neutralization. Mice were treated with anti-CD206 or IgG control (1 mg/kg) antibody every other day during the aHFD-challenge. (D) Representative images and quantification of C1,2C (red) staining in SAT of IgG- (n = 4) or anti-CD206-treated (n = 5) aHFD mice. Nuclei were stained with Dapi (blue, scale bar, 20 µm). Data are presented as a fold change of IgG control. (E) Blood glucose levels and (F) area under the curve (AUC) during oral glucose tolerance test (OGTT, n = 5/group). (G) Serum insulin levels and (H) AUC during OGTT (n = 5/group). mRNA expression of (I) Ccl2 (J) F4/80, and (K) Il1 in SAT of anti-CD206 or IgG-treated mice (n = 4/group). Expression is relative to Bactin. (L) Representative images and quantification of picrosirius red staining in SAT of anti-CD206 or IgG-treated mice (n = 4 to 5). For each sample, images were collected from more than six random fields. Data are presented as fold change compared to IgG control SAT (scale bar, 100 µm). (M) Adipocyte size distribution and (N) average adipocyte size calculated from the picrosirius red staining with ImageJ software and Adiposoft plugin. (O) Western blot analysis of COL6A3 in SAT of anti-CD206 or IgG-treated mice (n = 4/group). Band intensity was normalized to total protein amount on the membrane. Data are presented as mean ± SEM and are representative of two independent experiments (A–C). Unpaired student’s t tests, two-way ANOVA (A and M). *P < 0.05, **P < 0.01
