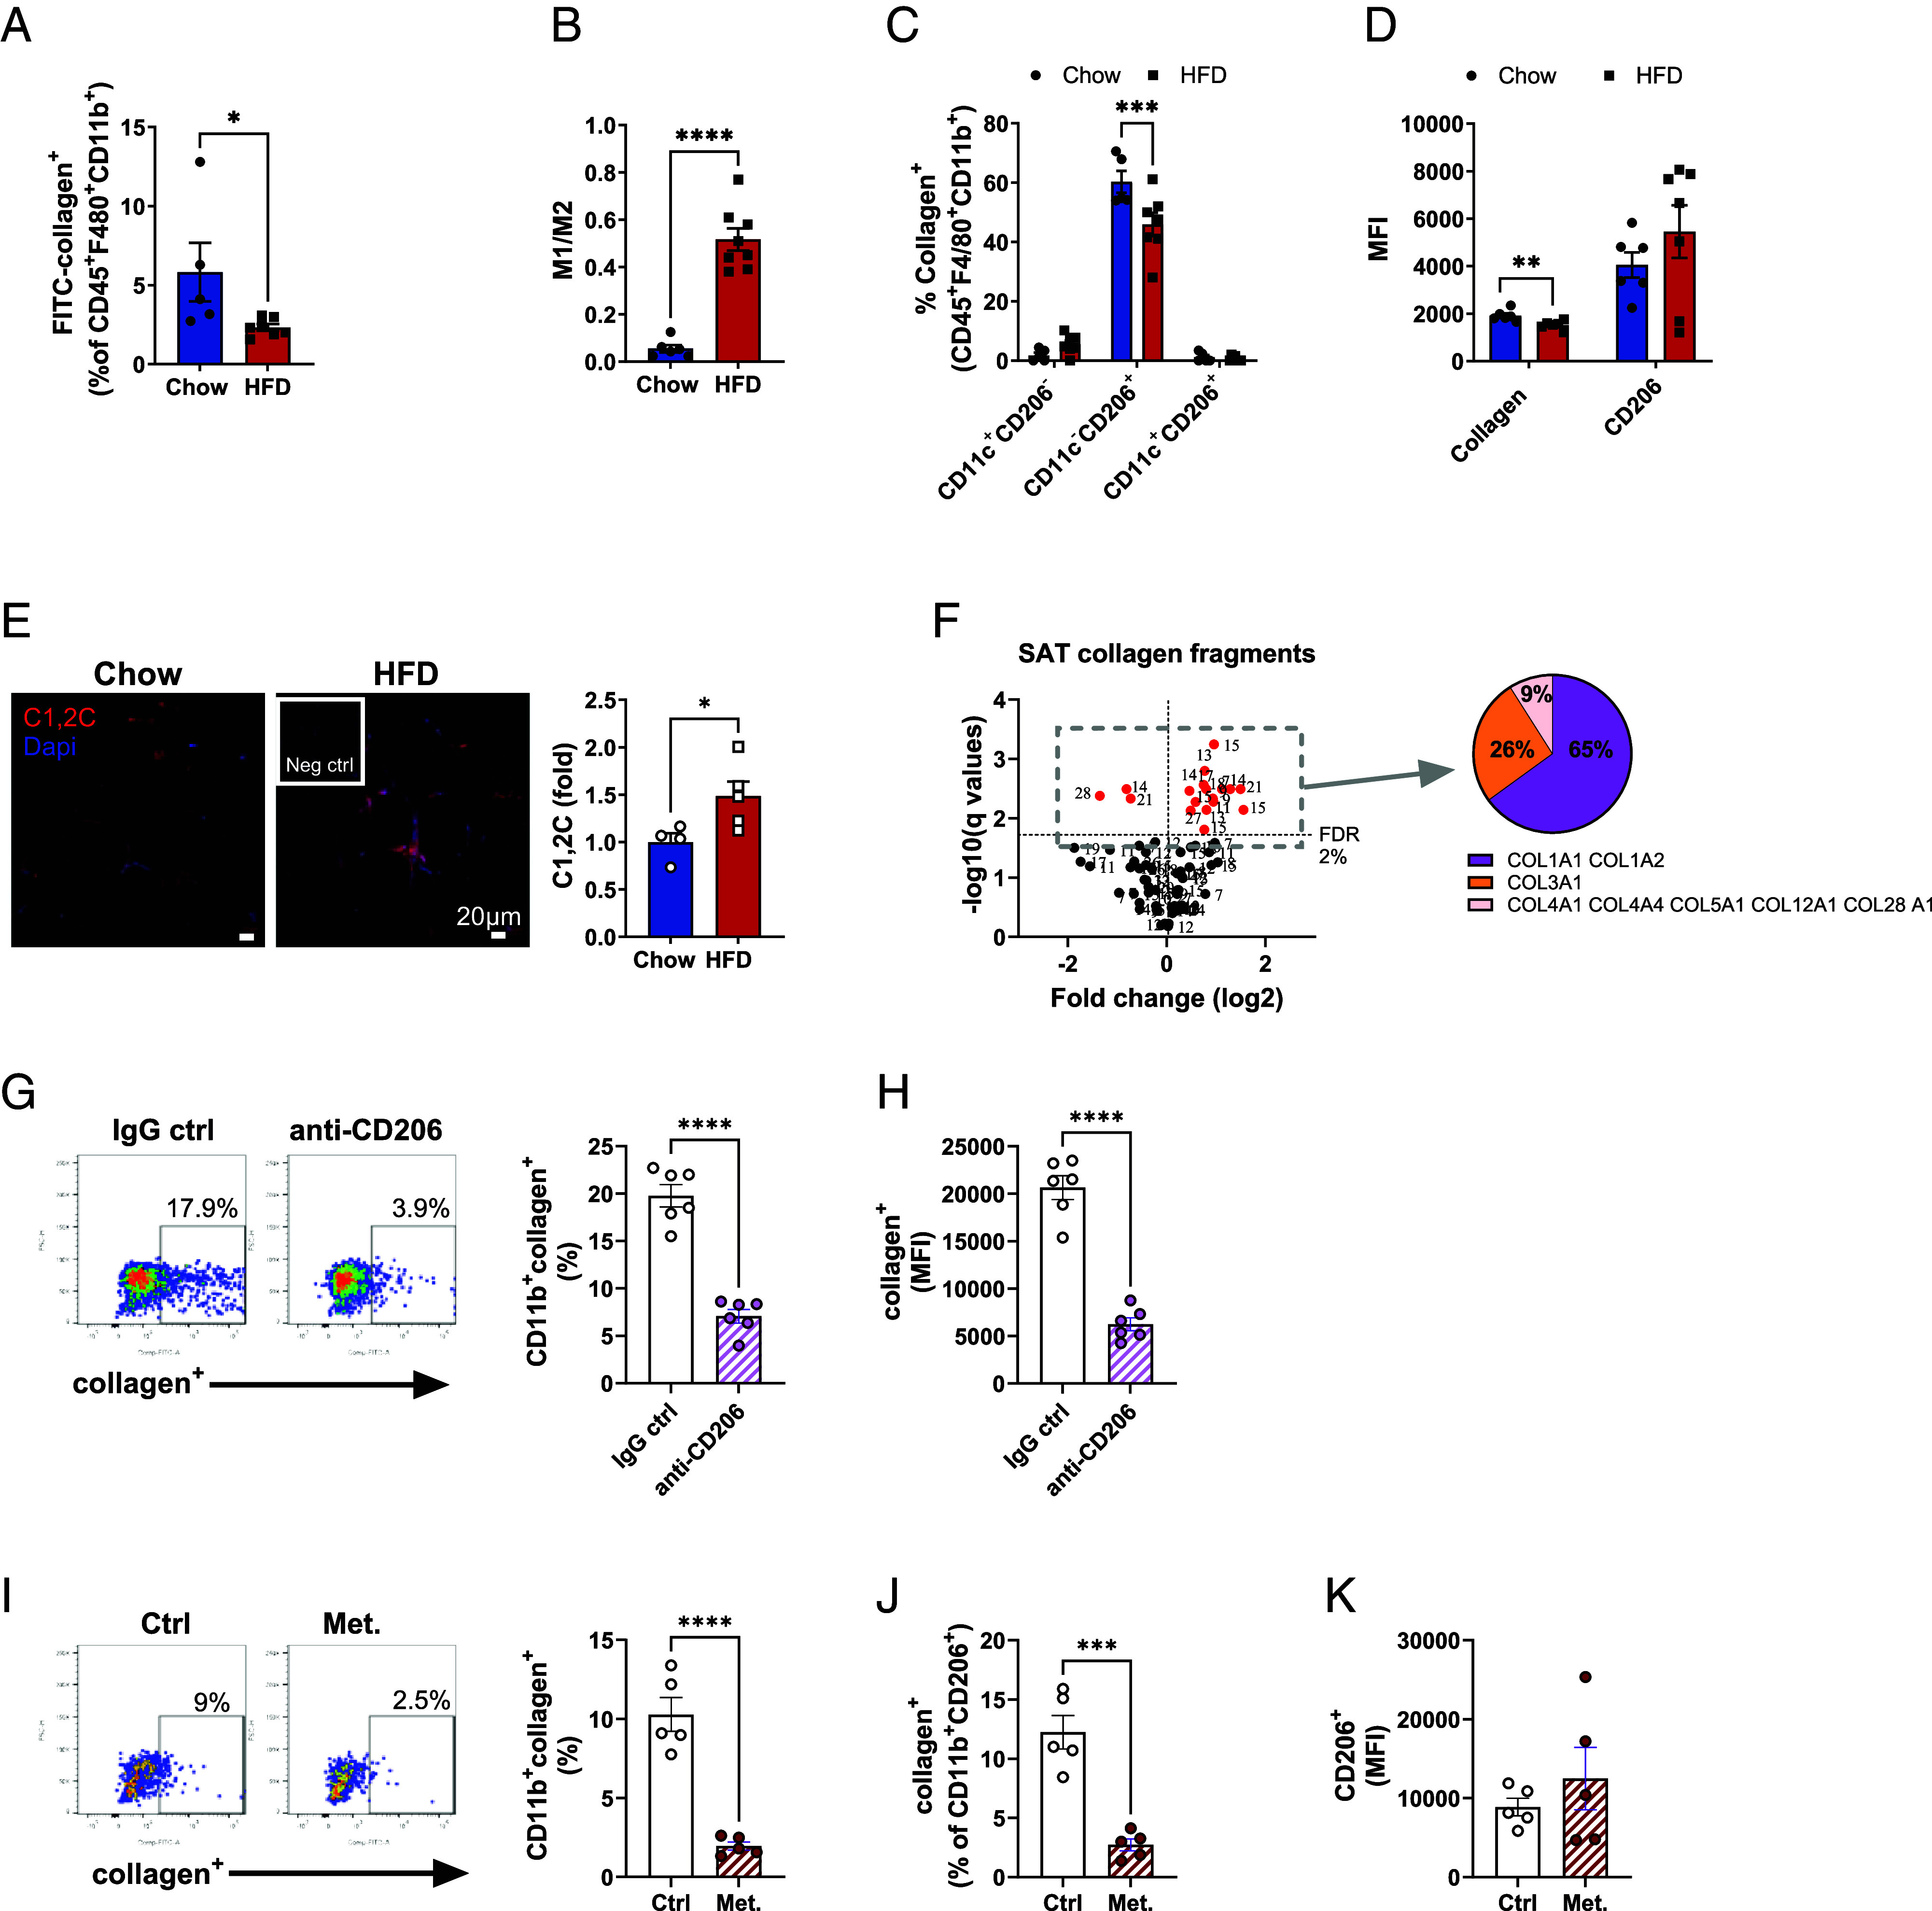
Fig. 4.

Macrophage-collagen axis is disrupted in SAT of obese insulin resistant mice. (A–F) Male C57BL/6 mice were placed on chow or HFD for 14 wk. (A) Percentage of collagen+ macrophages (single live CD45+F4/80+CD11b+) magnetically sorted from SAT of chow (n = 6) or mice fed with HFD (n = 8). (B) M1/M2 ratio in SAT of chow and HFD mice. M1 macrophages were defined as CD11c+CD206− and M2 as CD11c−CD206+ of total macrophages (single live CD45+F4/80+CD11b+). (C) Subset distribution of collagen+ macrophages. (D) Mean fluorescence intensity of collagen+ and CD206+ macrophages. (E) Representative images and quantification of C1,2C staining (red) in SAT of chow (n = 4) and HFD (n = 5) mice. Nuclei were stained with Dapi and data are presented as fold change of chow controls (scale bar, 20 µm). (F) Volcano plot of various fragmented collagens found in SAT of chow and HFD mice (n = 5/group). The number indicates amino acid length of each fragment (sequences are shown in SI Appendix, Table S1). Collagen+ human PBMC-derived M2-like macrophages (live CD3−CD19−CD56−CD66b−CD1c−CD11b+CD206+) in the presence of (G–H) anti-CD206 antibody or IgG control (10 µg/mL both) or (I–J) in the presence or absence of metabolic cocktail (25 mM glucose, 0.5 mM palmitate-BSA, 10 nM insulin). MFI values of (H) collagen and (K) CD206. Data are presented as mean ± SEM. Unpaired student’s t tests, two-way ANOVA (C), and multiple unpaired t test with Welch correction, corrected with false discovery rate set to 2% cut-off (F). *P < 0.05, **P < 0.01, ***P < 0.001, ****P < 0.0001
