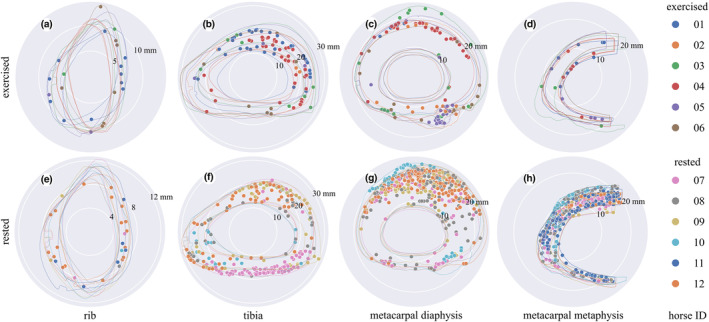
FIGURE 5.

Polar plots of the largest canals representing resorption spaces or cutting cones (Ca.Ar >0.04 mm2) in bones from the exercised (a, b, c, d) and rested (e, f, g, h) groups, centred on each sample's centre of mass. Canals are indicated by solid dots, and periosteal and endosteal contours are indicated by outlines, all colour‐coded by horse ID. Note the larger number of large canals in the rested metacarpal and tibial sites and their anatomical distribution in the caudal tibia, dorsal metacarpal diaphysis and throughout the metacarpal metaphysis. Cranial / dorsal to the top, medial to the right. Scale in mm given by numbers indicating the radius of the white circles on each plot. See Tables 5 and 6 for statistical summaries and comparisons.
