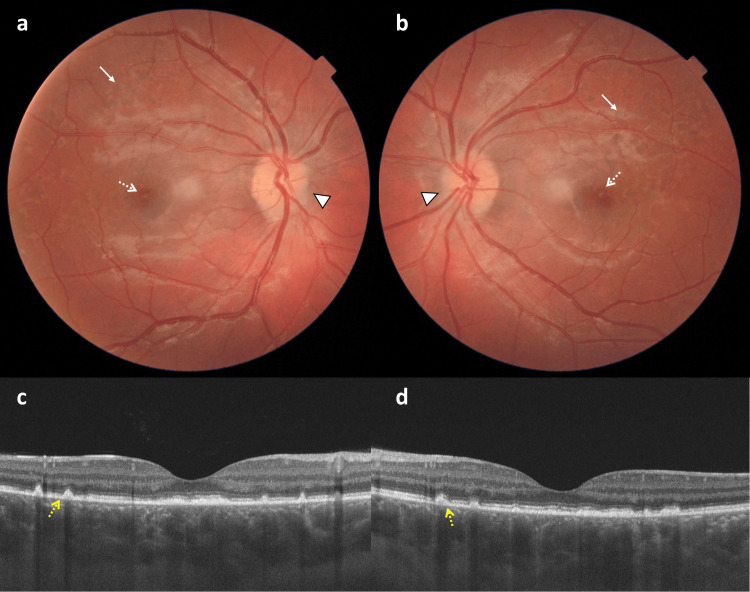
Figure 2. The color fundus photo and spectral domain optical coherence tomography scan at the first-month follow-up.
The color fundus picture shows subtle optic disc edema (white arrowhead), multiple dark, old choroidal infarct areas (white arrow) in the fundus periphery, and a drusen-like appearance in the macula (white dashed arrow) in the right (a) and left (b) eyes. Horizontal SD-OCT scan demonstrates subretinal drusenoid deposits (yellow dashed arrow) and disrupted ellipsoid zone in the macula, a thickened subfoveal choroid, and normal inner retinal layers in the right (c) and left (d) eyes.
SD-OCT, spectral domain optical coherence tomography

