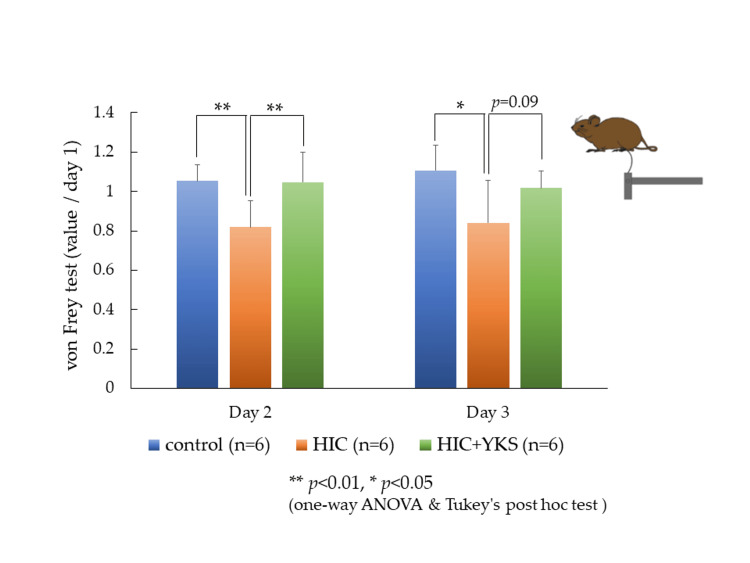
Figure 2. von Frey Test.
The values obtained on day 2 and day 3 are presented as the rate of change relative to the baseline value of 1.
Significant differences: * p < 0.05, ** p < 0.01 (one-way ANOVA and Tukey's post hoc test).
ANOVA: analysis of variance; HIC: Hunner-type interstitial cystitis; YKS: Yokukansan

