
Figure 2.
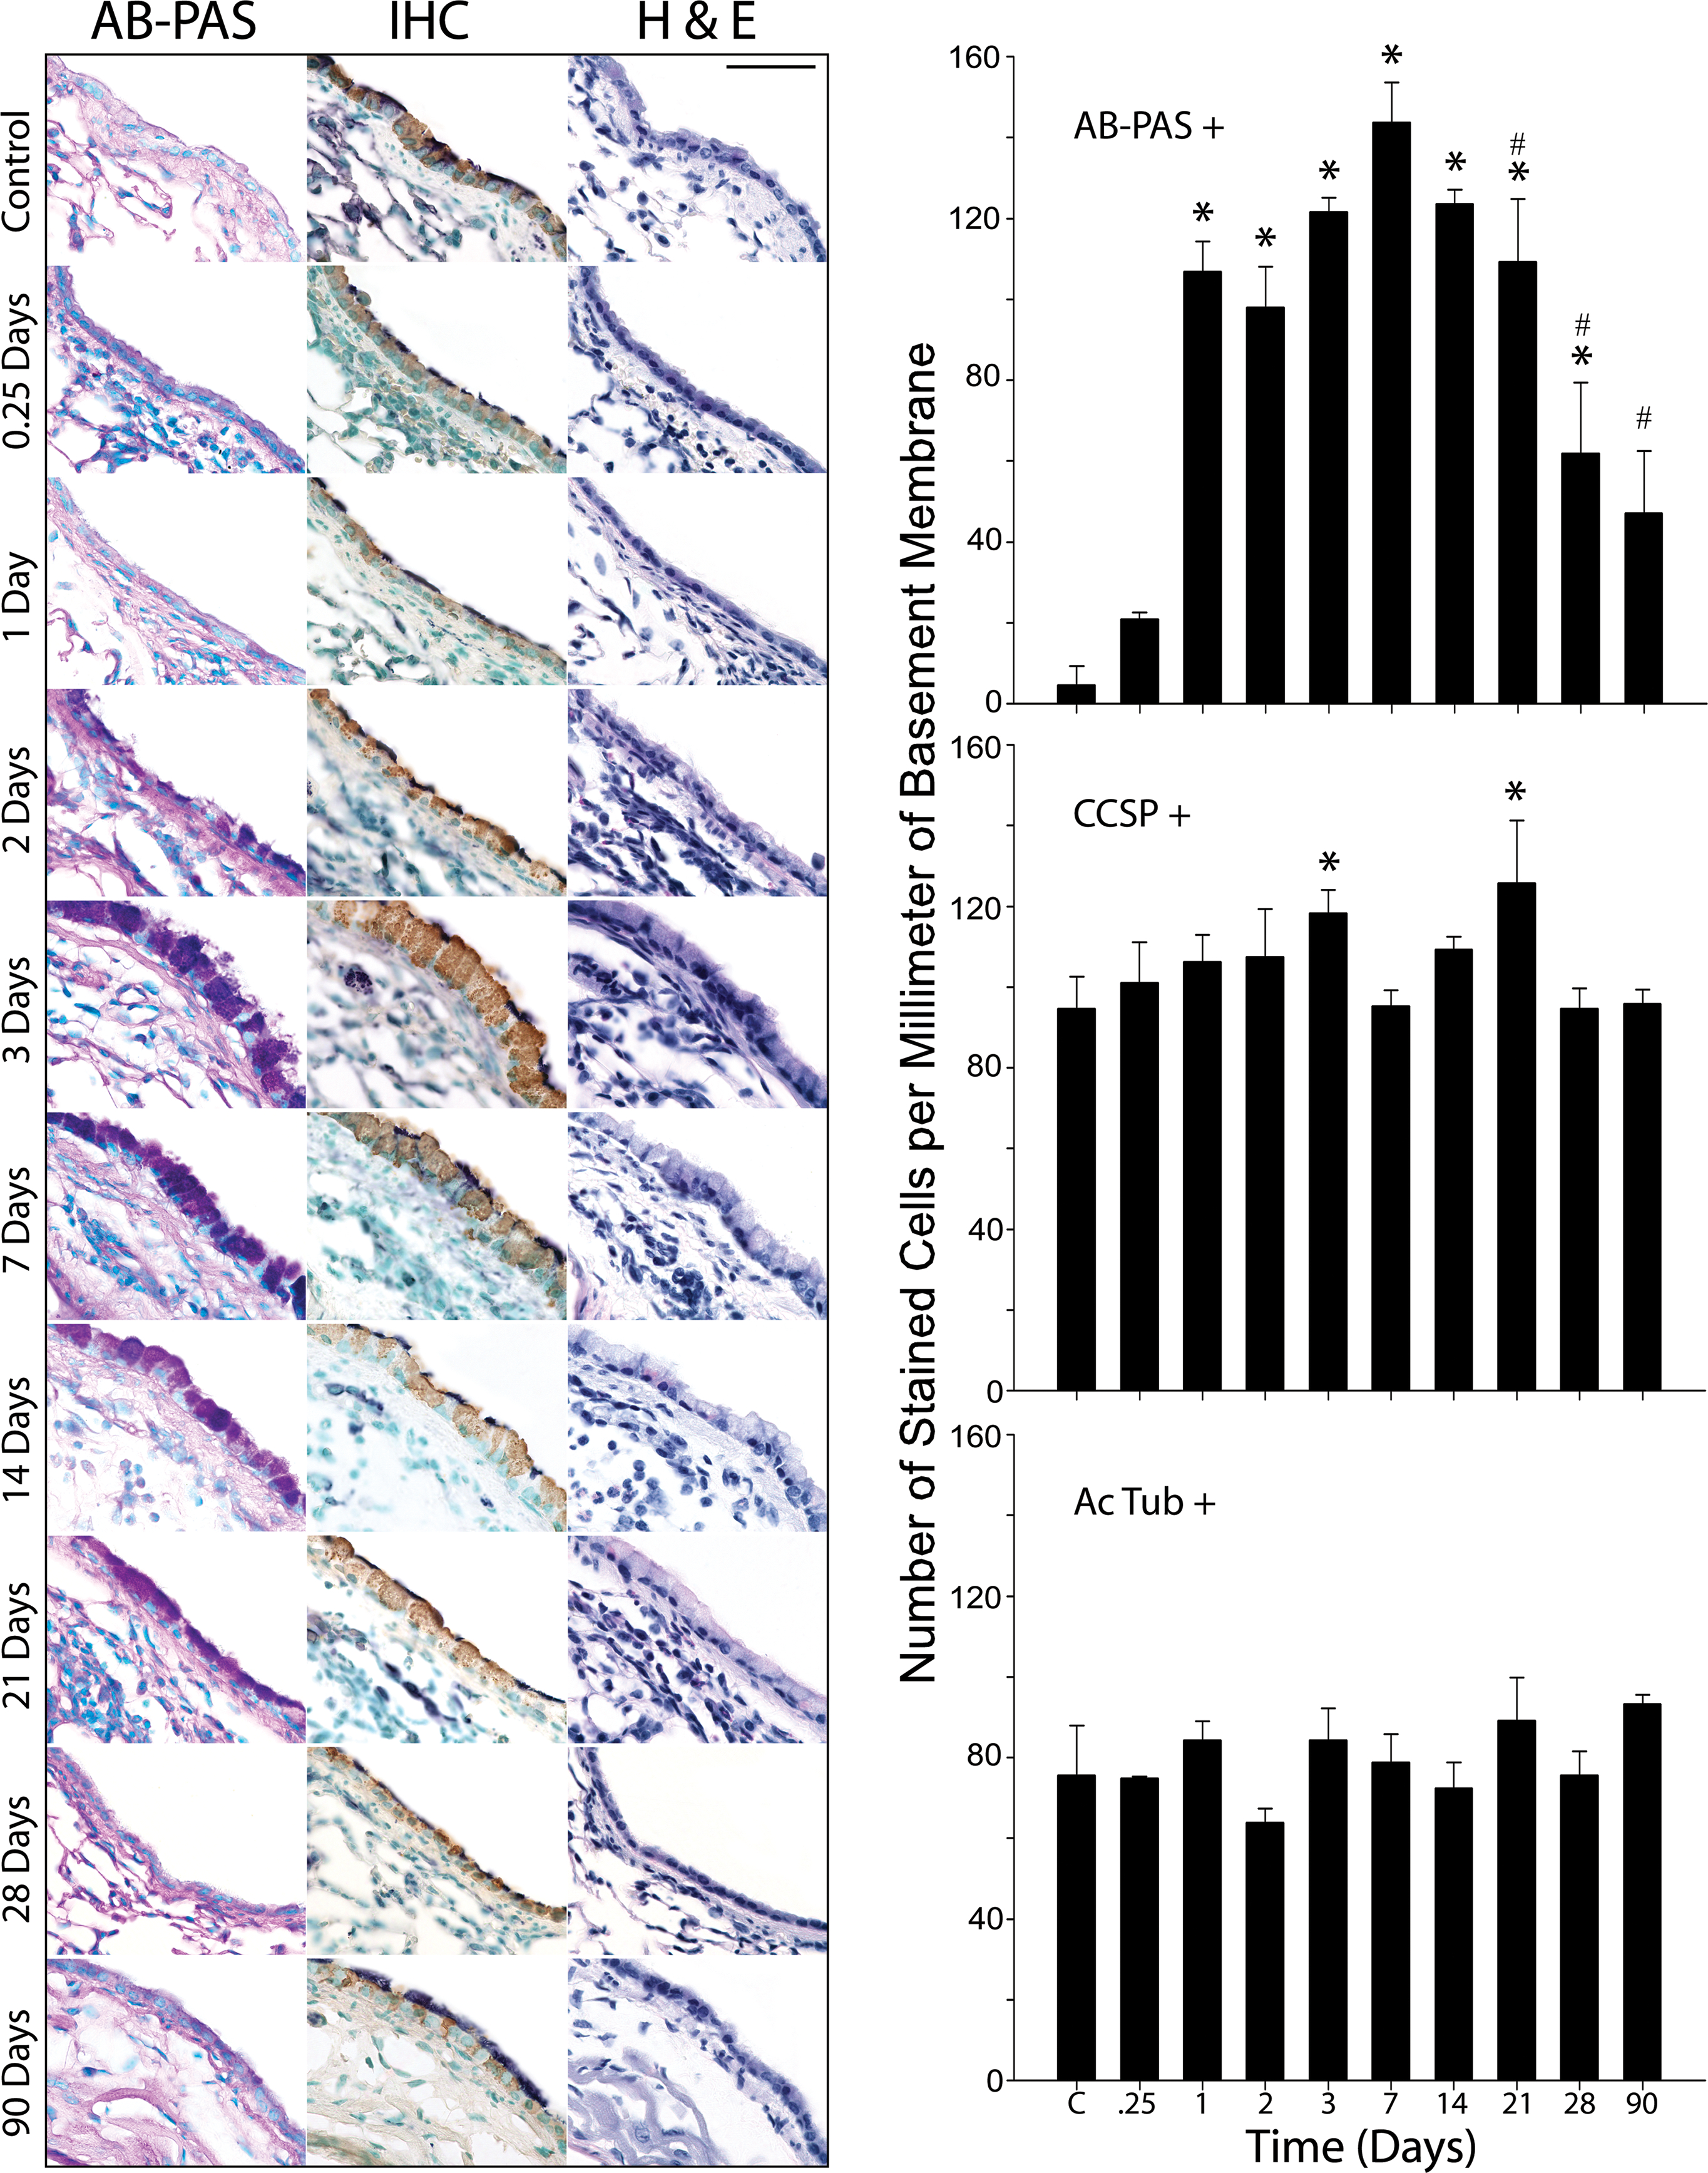
Antigen challenge causes a transient increase in mucin content in the airways with little alteration in the distribution of Clara and ciliated cells. In antigen challenged mice, the number of AB-PAS positive cells increases significantly 1 day after antigen challenge, peaks at day 7 and partially resolves at days 21–28 (top graph). Immunohistochemical staining (IHC column) of CCSP positive Clara cells (CCSP positive) reveals small but significant increases at day 3 and day 21 (middle graph). There are no significant changes in the numbers of ciliated cells (acetylated tubulin positive) throughout the timecourse (IHC column & lower graph). Hematoxylin & eosin (H & E) staining shows submucosal inflammation occurring during the period of increase mucin production (days 1–21). Three to six animals were used for each time point except for 0.25 days (n=2). * indicates statistically significant difference from control, and # signifies statistically significant difference from day 7. Scale bar is 50 μm.