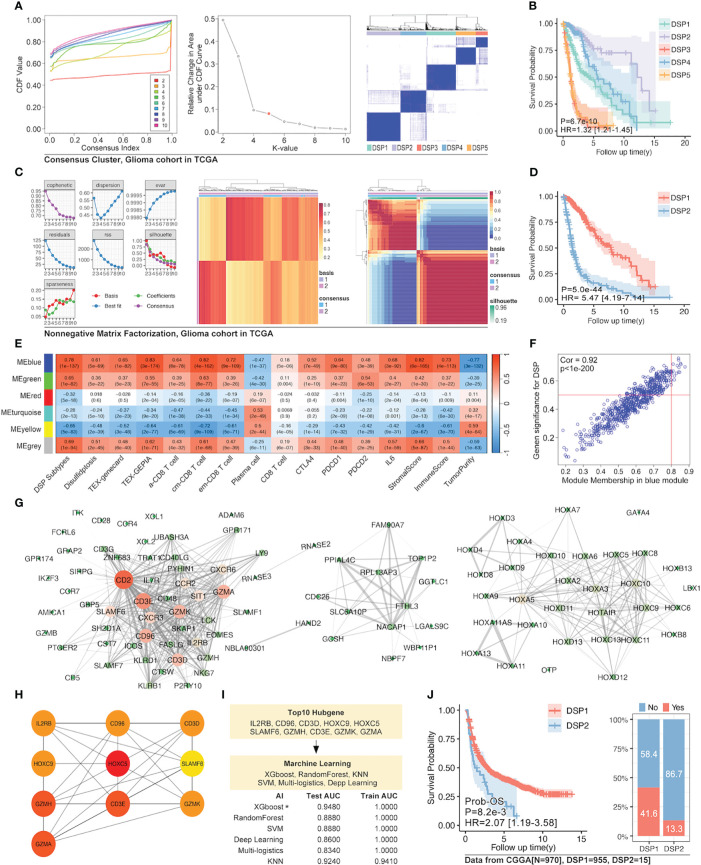
Figure 9.
Enhanced prognostic model in glioma by WGCNA and machine learning. (A) Unsupervised consensus clustering of 14 validated DRGs (B) and its survival analysis in the glioma cohort, which displayed a significant difference in prognosis (p=6.7e-10). (C) The clustering of 14 validated DRGs by Non-negative Matrix Factorization (NMF) divided the glioma cohort into two groups with (D) significantly different prognoses (p=5e-44). (E) WGCNA for NMF clustering DSP groups, in which blue module gene cohort was the most correlated to DSP grouping, immune cell infiltration, and immunecheckpoint expression (p<0.0001). (F) The correlation analysis of the blue gene module from WGCNA and DSP subtypes. The blue gene module (G) and its hub genes (H) network. (I) Enhanced prognostic model based on hub genes for patients with glioma by machine learning, among which the xgboost algorithm showed the best accuracy (testing AUC=0.9480). (J) The validation of the enhanced prognostic model in glioma patients from CGGA by KM analysis and immune checkpoint inhibitors response prediction (p<0.001).

