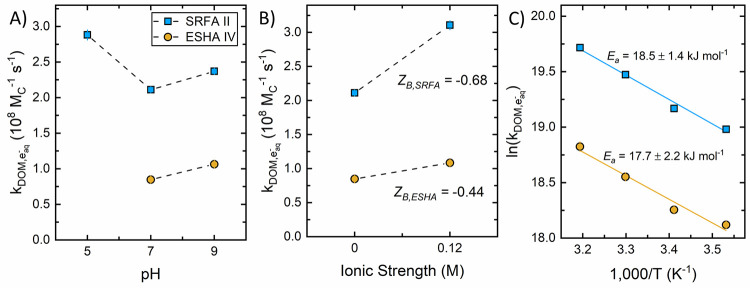
Figure 2.
Influence of (A) pH, (B) ionic strength, and (C) temperature on bimolecular rate constants for SRFA II and ESHA IV. Experiments conducted at 22 ± 2 °C, pH 7.0 ± 0.1, and 10.0 mM dibasic phosphate buffer unless otherwise specified. The ZB in (B) was calculated from the Brønsted-Bjerrum equation (eq 3.1) using the charge of eaq– (i.e., ZA = −1). Error bars represent the standard error of the bimolecular rate constant (majority of error bars are within markers). Additional plots of the pseudo-first-order rate constant against the DOM concentration for each pH, temperature, and ionic strength condition are provided in SI Figures S3 and S4.

