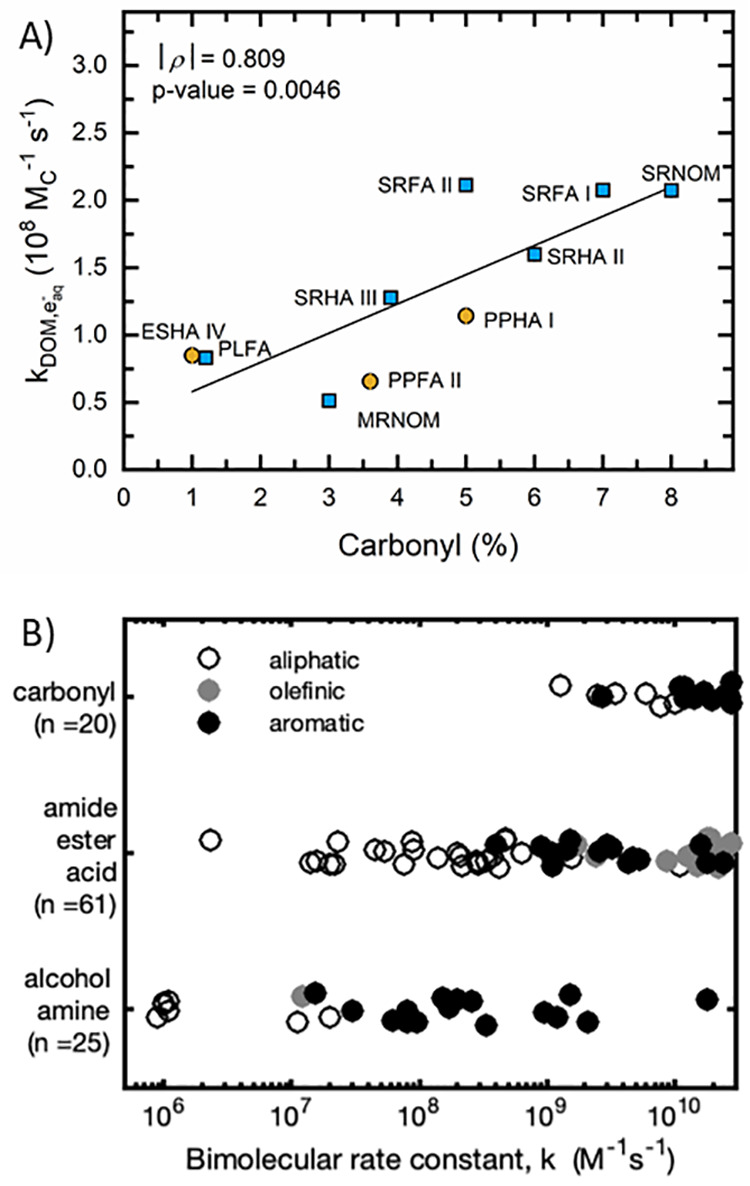
Figure 3.

Relationships between DOM composition and eaq– bimolecular rate constant. (A) Correlation kDOM,e–aq and % carbonyl carbon as determined by 13C NMR and reported by the IHSS. Markers refer to values derived from the slope of first-order rate constants vs [DOM] (e.g., Figure 1C), and error bars refer to the standard error of the slope (majority of error bars are within markers). Marker color represents terrestrial (brown) and aquatic isolates (blue). SRNOM data represent SRNOM I for carbonyl % and SRNOM II for kDOM,e–aq. All other IHSS catalog numbers match exactly. Experiments conducted at 22 ± 2 °C, pH 7.0 ± 0.1, and 10.0 mM dibasic phosphate buffer. (B) Bimolecular rate constants between model organic compounds and eaq– from literature sources (accessed via https://kinetics.nist.gov/solution/).67
