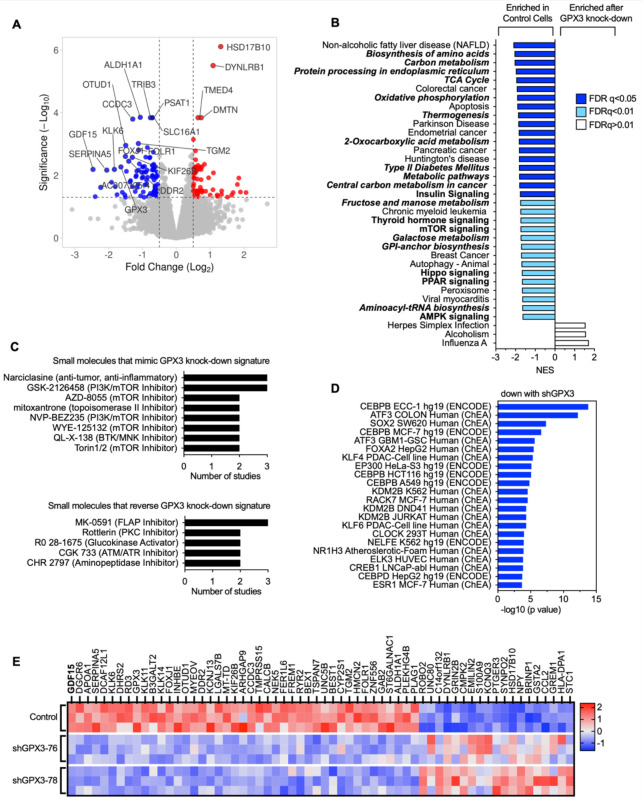
Figure 2. RNA sequencing demonstrates downregulation of pro-tumorigenic signaling pathways in response to GPX3 knock-down in OVCAR3 cells.
A. Volcano plot of differentially expressed genes (DEGs) following GPX3 knock-down using two different shRNAs (shRNA-76 & shRNA-78; n=3) relative to scramble shRNA control transduced OVCAR3 cells.
B. Gene set enrichment analysis of RNA sequencing data following GPX3 knock-down (KEGG) demonstrates enrichment of tumor associated metabolic pathways in control cells relative to GPX3-knock-down cells.
C. Small Molecule Query (L1000CDS2) was carried out to identify gene expression signatures that mimic or reverse gene expression changes following GPX3 knock-down.
D. Transcription factor enrichment analysis (ENCODE & ChEA) on RNAsequencing data following GPX3 knock-down.
E. Heat map of top differentially expressed protein coding genes (DEG) following GPX3 knock-down (z-scores; log 2-fold change >1, p adjust <0.05).

