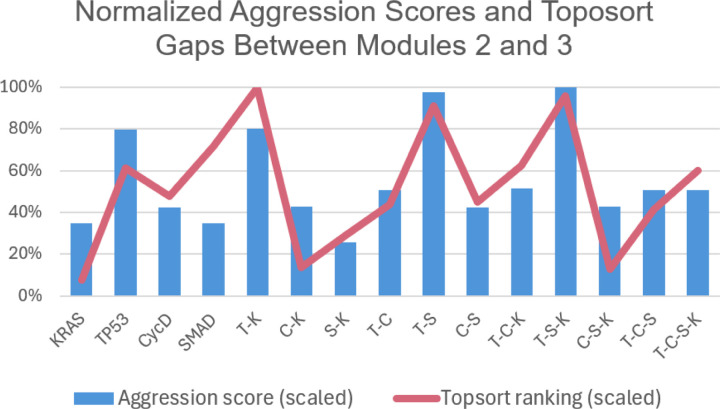
Figure 8: Normalized toposort gaps between Modules 2 and 3.
After comparing the toposort rankings and gaps across all modules (Figure 7), the gaps between Modules 2 and 3 (i.e. the modules communicating to the PCC phenotypes) were identified as the most critical. Here we show a normalized scoring that indicates the largest variance (or distance) between Modules 2 and 3 best aligns with the predicted aggression scores from Figure 3.

