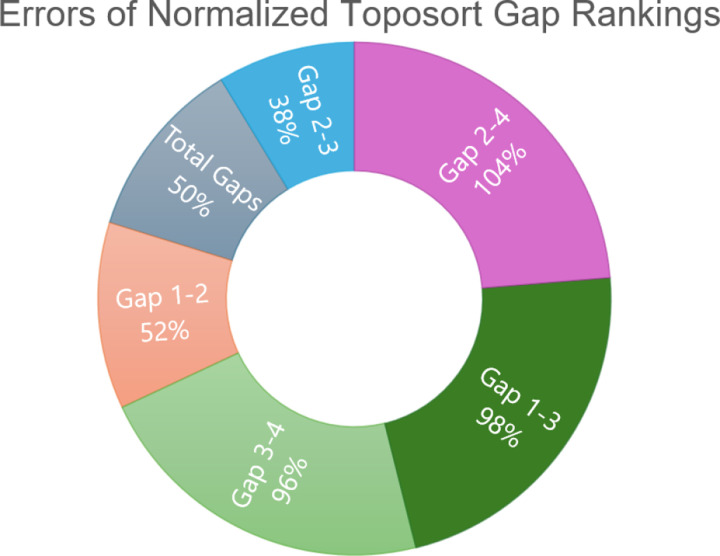
Figure 9: Errors of normalized toposort gap rankings.
This chart is a comparison of average errors after ranking and normalizing toposort gaps, compared to the normalized aggression scores from Figure 3. Gaps between Modules 2 and 3 best explain the predicted aggression scores, further shown in Figure 8.

