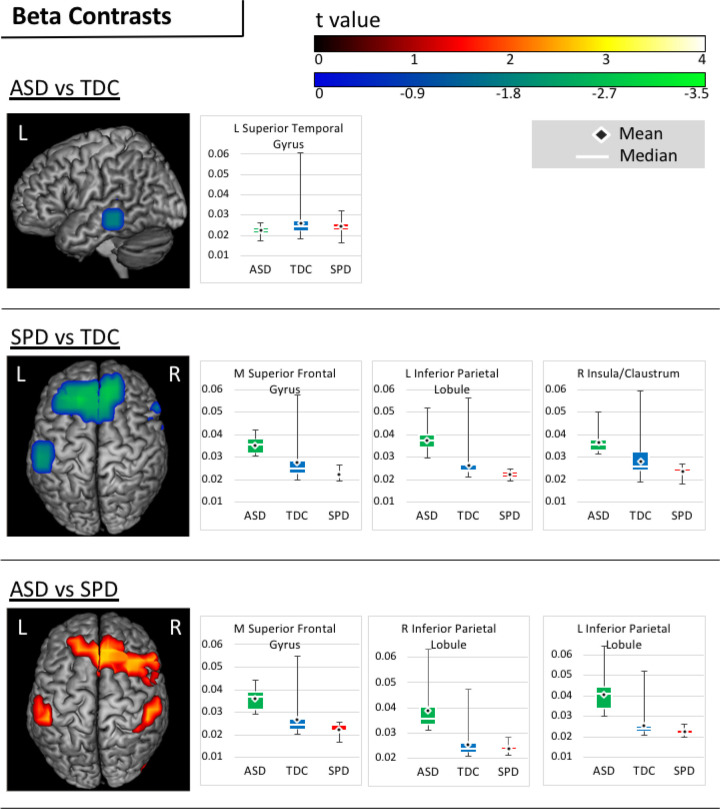
Figure 3.
Beta Contrasts. Areas of significantly increased (warm) and reduced (cool) beta connectivity are presented on figures for each pairwise contrast. Accompanying boxplots are presented for each cluster showing imaginary coherence values for all groups at the voxel within that cluster that demonstrated the greatest pairwise difference.

