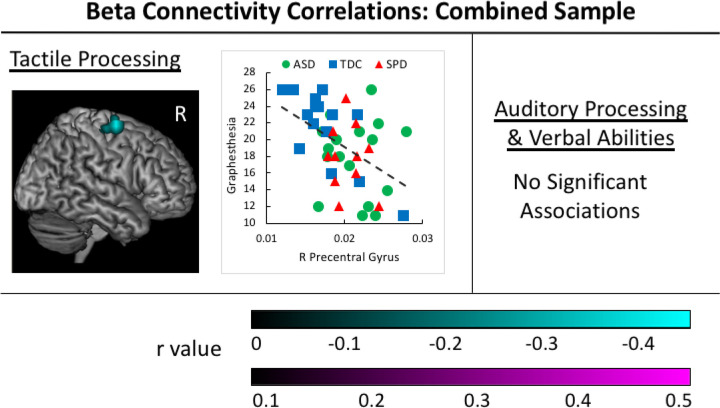
Figure 4.
Beta Correlations in the Combined Participant Sample. Negative associations between tactile processing abilities and beta connectivity values are identified in the cyan cluster for the sample of all participants in the study. The corresponding scatterplot is presented for the voxel with the greatest correlation value within each cluster, with groups identified by color and shape (ASD group = yellow circle, SPD group = green triangle, and TDC group = grey square).

