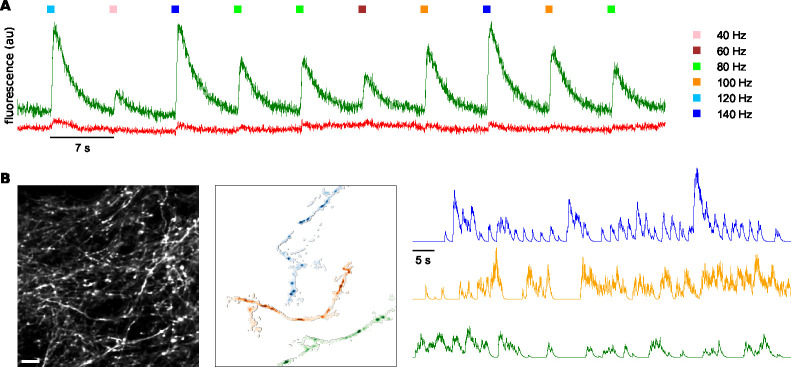
Figure 1. Experimental design and spatiotemporal analysis of axonal branches.
A: Fluorescence responses of axons to electrical stimulation of neuropil at different stimulation frequencies; GCaMP6s in green, mRuby3 in red. B: Computational extraction of axonal branches, separating different axons and neuropil background based on activity. Scale bar: 10 μm.

