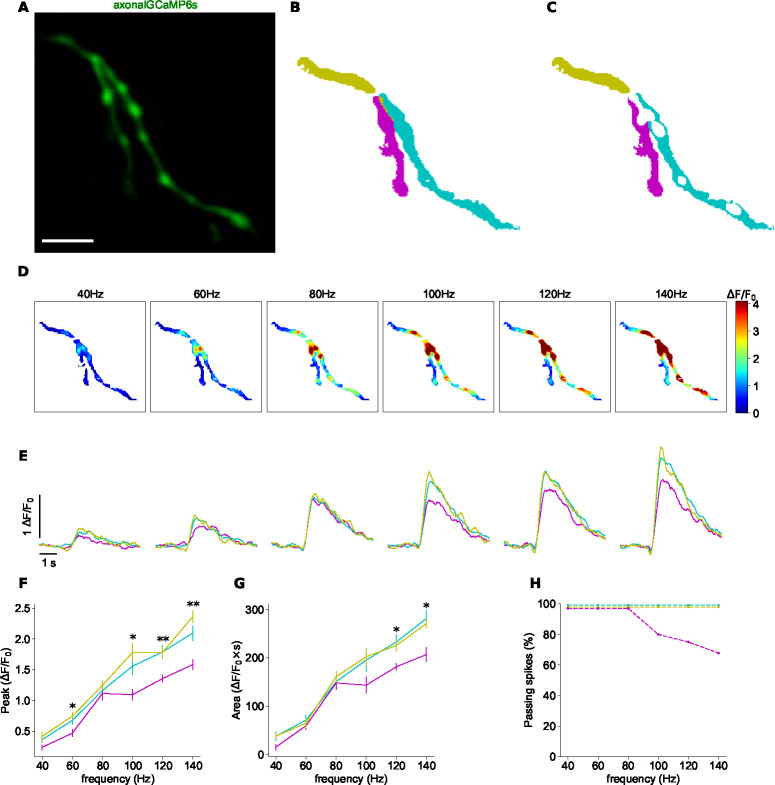
Figure 4. Differential spike propagation in axonal branches.
A: Time-averaged image of GCaMP6s activity during electrical stimulation. Scale bar: 5 μm. B: Color map of parent and two secondary branches. C: Color map of parent and two secondary branches after removing the axonal boutons. D: Maps of normalized peak amplitudes at each frequency. E: Normalized GCaMP6s/mRuby3 signal for each branch at different frequency. Average of 7 trials. Colors according to branches in 4C. F: Peak amplitudes of signals in 4E as a function of frequency. G: Area under curve of signals in 4E as a function of frequency. Vertical lines show standard error. Asterisks indicate statistical significance differences between signals; Kruskal-Wallis H-test. H: Percentage of signals that propagate at each branch, as a function of frequency.

