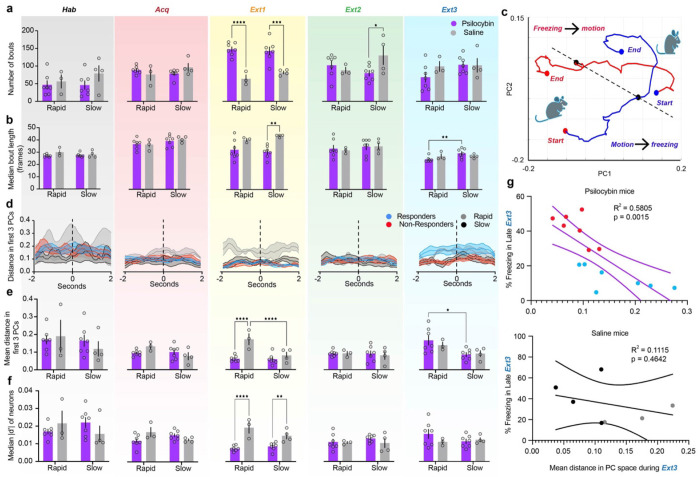
Figure 3 |. Psilocybin alters dynamics and encoding of freezing behavior.
a. Total number of freezing bouts per session. (Left to right, Black = Habituation, Red = Acquisition, Yellow = Extinction 1, Green = Extinction 2, Blue = Extinction 3). Two-way ANOVA. (Supp. Table 1, rows 29-33). b. Median bout length per session in frames. Two-way ANOVA. (Supp. Table 1, rows 34-38). c. Representative average trajectories of motion-to-freezing (blue line, bout start) and freezing-to-motion (red line, bout end) transitions in the first two PCs, from two seconds before to two seconds after transition. (Black point = time of transition, red points = starting and ending points in motion, blue points = starting and ending points in freezing) A dashed line is drawn between the two transition points. d. Average Euclidean distance in PC space between each pair of points in motion-to-freezing and freezing-to-motion trajectories in the first three PCs on each day. Dashed line indicates time of behavioral transition. Shaded areas are SEM. e. Mean distance in PC space between bout start and bout end over the four-second time window between trajectories. Two-way ANOVA. (Supp. Table 1, rows 39-43). f. Median absolute value of d-prime between motion and freezing in all recorded neurons on each day. Two-way ANOVA. (Supp. Table 1, rows 44-48). g. Linear regression of distance in PC space between trajectories (Fig. E, right) and % trace period freezing in late Extinction 3 in psilocybin (top) and saline mice (bottom). (Supp. Table 1, rows 49-50). Data are mean ± SEM. * p ≤ 0.05, ** p < 0.01, *** p < 0.001, **** p < 0.0001.

