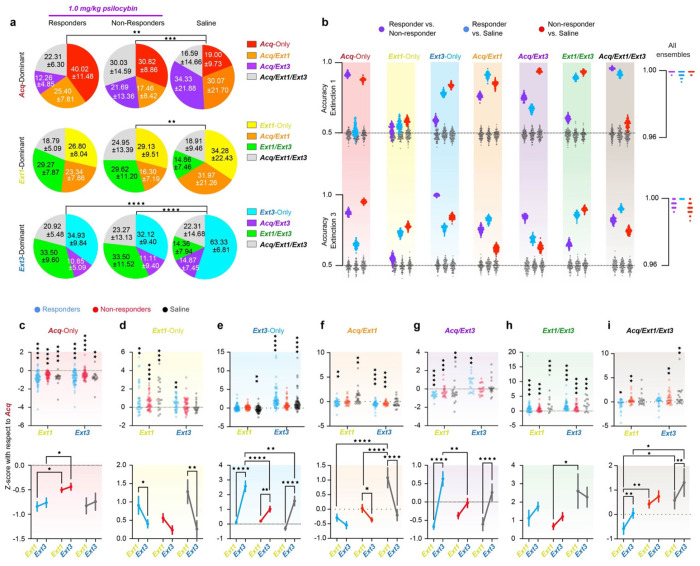
Figure 6 |. Psilocybin bidirectionally modulates neural ensembles driving RSC dynamics during TFC in responders.
a. Pie charts describing the average overlap of the Acq-, Ext1, and Ext3-dominant ensembles (top, middle, bottom) in responders, non-responders and rapidly extinguishing saline-administered mice. Numbers are mean ± SEM. Stars indicate comparisons between each psilocybin group and saline. Chi-square test. (Supp. Table 1, rows 77-79) b. Accuracies of 100 Fisher decoders trained to predict responder status (left cloud, purple), responders from rapidly extinguishing saline-administered mice (middle cloud, blue around grey), and non-responders from saline administered mice (right cloud, red around grey). Grey clouds are the same decoders tested on shuffled class labels. Decoders were trained on activity during Extinction 1 (top) and Extinction 3 (bottom). Right-hand panels accuracies of decoders trained on all seven ensembles as predictors. c. Top: z-score activity in individual Acq-Only neurons in each ensemble from Acquisition. Wilcoxon rank-sum to test if change is different from zero. Bottom: Same data displayed as mean ± SEM. Two-way RM ANOVA to compare changes over time and between groups. (Supp. Table 1, rows 80-81) d-i. Same as C for Ext1-Only, Ext3-Only, Acq/Ext1, Ext1/Ext3, Acq/Ext3, and Acq/Ext1/Ext3, respectively. (Supp. Table 1, rows 82-93) * p ≤ 0.05, ** p < 0.01, *** p < 0.001, **** p < 0.0001

