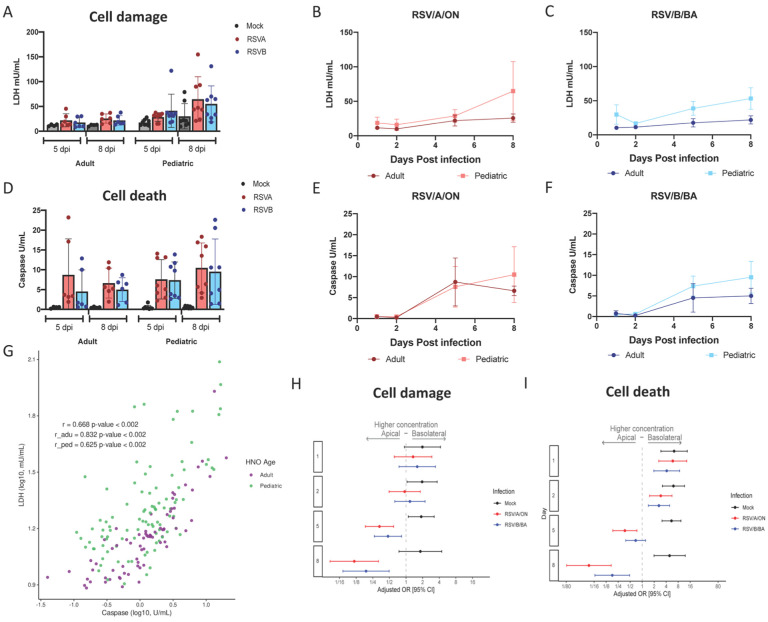
Figure 3. Cell death and damage during RSV infection in pediatric and adult HNO-ALIs.
LDH and caspase area were modeled on the following factors: interacting cell surface, viral infection, and dpi as well as age. A) Amount of cell damage, measured by apical LDH, at day 5 and day 8 in adult vs pediatric HNO-ALIs, infected with RSV/A/ON, RSV/B/BA, or mock infection. B) Amount of apical LDH in 4 pediatric versus 4 adult HNO-ALIs infected with RSV/A/ON. C) or RSV/B/BA. D) Amount of cell death, measured by apical caspase, at day 5 and day 8 in adult vs pediatric HNO-ALIs, infected with RSV/A/ON, RSV/B/BA, or mock infection. E) Amount of apical caspase in 4 pediatric vs 4 adult HNO-ALIs infected with RSV/A/ON. F) or RSV/B/BA. G) Spearman correlation of pediatric and adult levels of LDH and caspase. Each dot represents the mean value of each unique experimental condition where both LDH and caspase were measured. Adult and Pediatric samples are colored magenta and green, respectfully H) Forest plot with adjusted odds ratio with 95% confidence intervals of apical or basolateral expression of LDH. I) Forest plot of adjusted odds ratios of apical or basolateral expression of caspase. Adjusted odds ratio estimates with 95% confidence intervals are represented by dots and T-bars, respectively.

