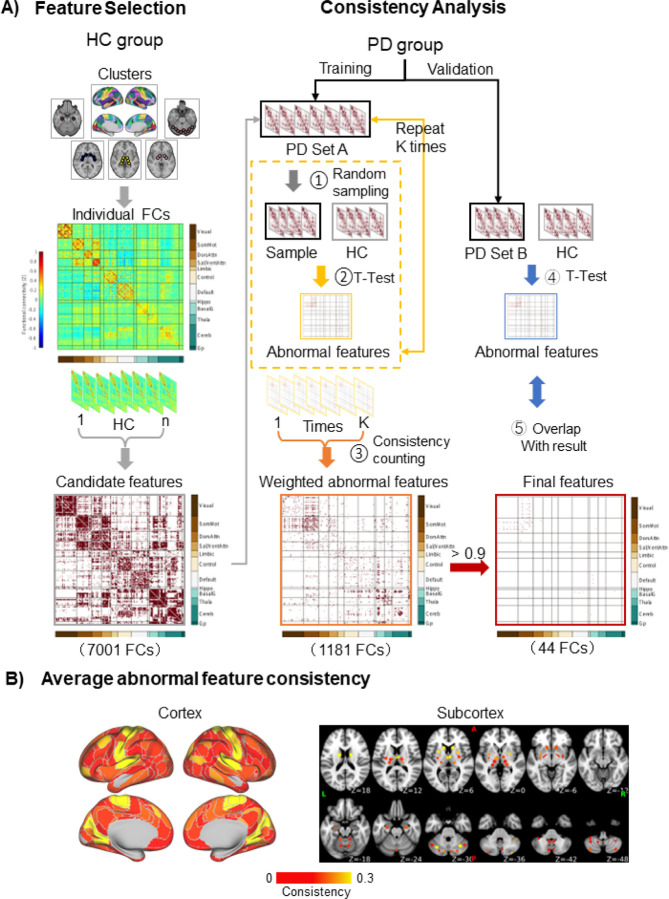
Figure 1. Biomarker identification process.
A) Feature selection: In the HC group, the FC strengths of all cluster pairs were calculated. Those that were significantly different from 0 (one sample t-tests) were retained, yielding 7,001 candidate features. Consistency analysis: One hundred permutations were performed, in which 51 PD patients were randomly selected from the discovery subset (n=112), forming PD set A (step 1). From the candidate features, abnormal features were found by identifying the features that significantly differed (independent samples t-tests, False Discovery Rate q=0.05) between PD patients and HC in each permutation (step 2). This process yielded 1,181 abnormal features. The consistency was calculated for each abnormal feature, defined as the percentage of permutations in which the feature was significantly different between groups. An abnormal FC matrix was generated, weighted by consistency (step 3). The 44 features that were significantly different between groups in ≥90% of the permutations were deemed to be consistently associated with PD (final features). The final features were validated in the independent validation subset of patients, PD set B, by identifying abnormal features (step 4) and determining how many of the 44 final features were among them (step 5). (B) The average consistency is shown for each cortical and subcortical cluster. The abnormal features are primarily located in the sensorimotor and visual areas of the cerebral cortex, cerebellum, caudate nucleus, putamen, and thalamus.
FC=functional connectivity; HC=Healthy control; PD=Parkinson’s disease.

