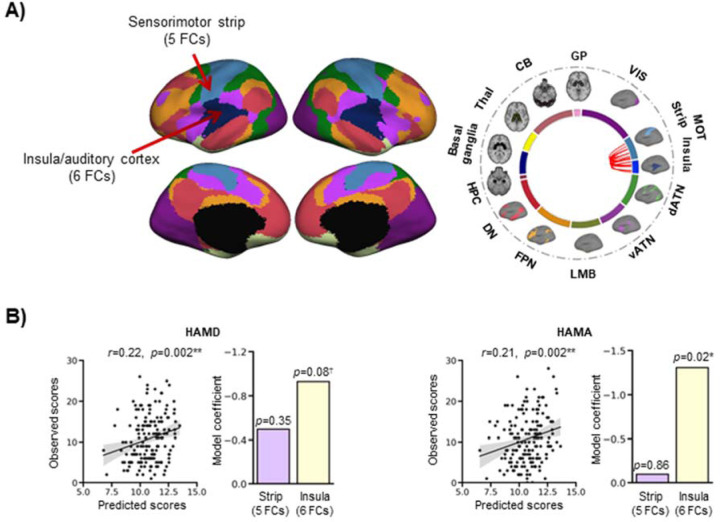
Figure 4. The insula connections are important predictors of mood measures.
(A) The sensorimotor network was divided into two: one portion included the classic sensorimotor strip (n=5 connections), and the other included the rest of the network, i.e. the insula and auditory cortex (n=6 connections). The circos plot illustrates the within-network connections of the prediction model, all located in the large-scale sensorimotor network. Most of these connections link the sensorimotor strip and the insula/auditory cortex. (B) There were significant correlations between predicted and observed scores for the HAMD (R=0.22, p=0.004) and HAMA (R=0.21, p=0.004). The bar graphs show the model coefficients of the two portions of the sensorimotor network. The insula/auditory cortex connections contributed to the prediction of mood measures (HAMD: p=0.08; HAMA: p=0.02), while the sensorimotor strip connections did not (HAMD: p=0.35; HAMA: p=0.86). The shaded band indicates the 95% confidence interval of the best-fit line.
*p<05; **p<0.01; †0.05>p<0.1
CB=cerebellum; dATN=dorsal attention; DN=default; FC=functional connectivity; FPN=frontoparietal; GP=globus pallidus; HAMA=Hamilton Anxiety Rating Scale; HAMD=Hamilton Depression Rating Scale; HPC=hippocampus; LMB=limbic; MOT=sensorimotor; Thal=thalamus; vATN=ventral attention; VIS=visual.

