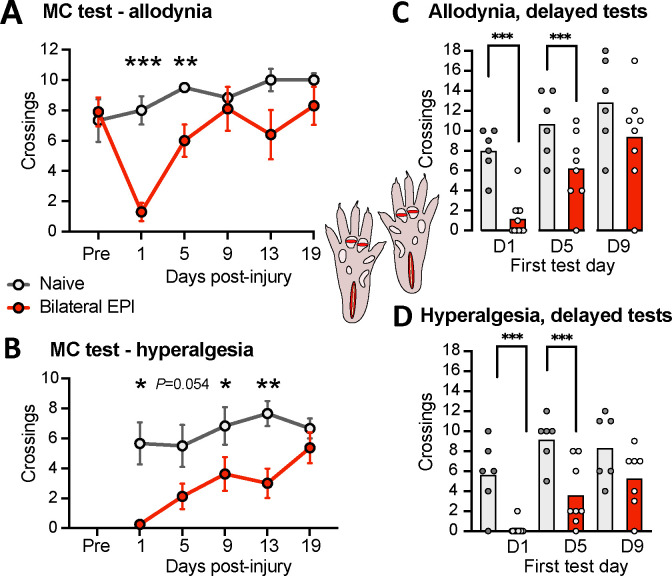
Figure 4.
Mechanical allodynia and hyperalgesia after bilateral extended plantar incision (EPI) as revealed by the operant MC test (inset, diagram of the EPI model). (A) Mechanical allodynia indicated by reduced number of crossings of innocuous 1-mm probes. Two-way ANOVA followed by Bonferroni tests: test x treatment, F(5,70) = 4.53, P = 0.0012; test, F(2.95, 41.3) = 6.72, P = 0.0009; treatment, F(1,14) = 4.16, P = 0.060. Asterisks indicate differences between naïve and EPI groups. (B) Mechanical hyperalgesia indicated by reduced number of crossings of noxious 4-mm probes. Two-way ANOVA followed by Bonferroni tests: test x treatment, F(4,56) = 1.81, P = 0.139; test, F(2.95, 41.4) = 5.15, P = 0.0042; treatment, F(1,14) = 14.75, P = 0.0018. Asterisks indicate differences between naïve and EPI groups. (C) Mechanical allodynia when the first test was given 5 but not 9 days post-injury. The hypothesis that allodynia would be present during the first test post-injury was tested with unpaired t-tests for each initial test time (day 5 or day 9) versus the naïve group at the same test time. Results from the first test at day 1 are replotted from panel A for comparison. (D) Mechanical hyperalgesia when the first test was given 5 but not 9 days post-injury. The hypothesis that hyperalgesia would be present during the first test post-injury was tested with unpaired t-tests versus the naïve group at the same initial test time. Results from the first test at day 1 are replotted from panel B for comparison. Averages in all panels are mean values. EPI, extended plantar injury (bilateral); PID, postinjury day.

