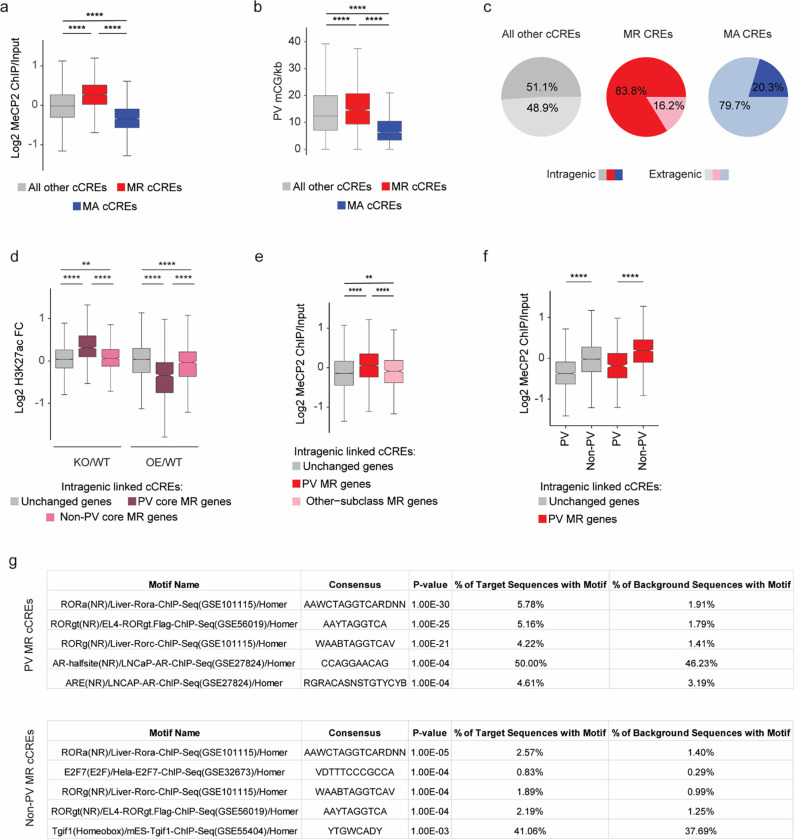
Extended Data Fig. 4. Distribution of epigenomic signals at MeCP2-regulated cCREs in PV interneurons.
a, Log2 input-normalized MeCP2 ChIP signal at MeCP2-repressed (MR) and MeCP2-activated (MA) cCREs in PV cells. ****p < 0.0001 two-sided Wilcoxon rank-sum test. b, Boxplot of PV mCG/kb in MeCP2-regulated cCREs. ****p < 0.0001 two-sided Wilcoxon rank-sum test. c, Genic distributions of MeCP2-regulated cCREs showing enrichment of MR cCREs to be intragenic. d, Log2 H3K27ac ChIP fold-change (MeCP2 mutant/wild-type) in cCREs inside and linked to PV core MR, non-PV core MR, or unchanged genes. **p < 0.01, ****p < 0.0001 two-sided Wilcoxon rank-sum test. e, Log2 input-normalized MeCP2 ChIP-seq signal in cCREs inside and linked to PV MR genes, other-subclass MR genes, or unchanged genes. **p < 0.01, ****p < 0.0001 two-sided Wilcoxon rank-sum test. f, Log2 input-normalized MeCP2 ChIP-seq signal in PV cCREs and non-PV cCREs inside and linked to PV MR genes or unchanged genes. ****p < 0.0001 two-sided Wilcoxon rank-sum test. g, HOMER output showing ROR family motif enrichment in PV and non-PV cCREs.
n=3 biological replicates for PV WT, MeCP2 KO, and MeCP2 OE H3K27ac ChIP-seq. In all boxplots, the center line of each boxplot is the median. Each box encloses the first and third quartile of the data. The whiskers extend to the most extreme values, excluding outliers which are outside 1.5 times the interquartile range.

