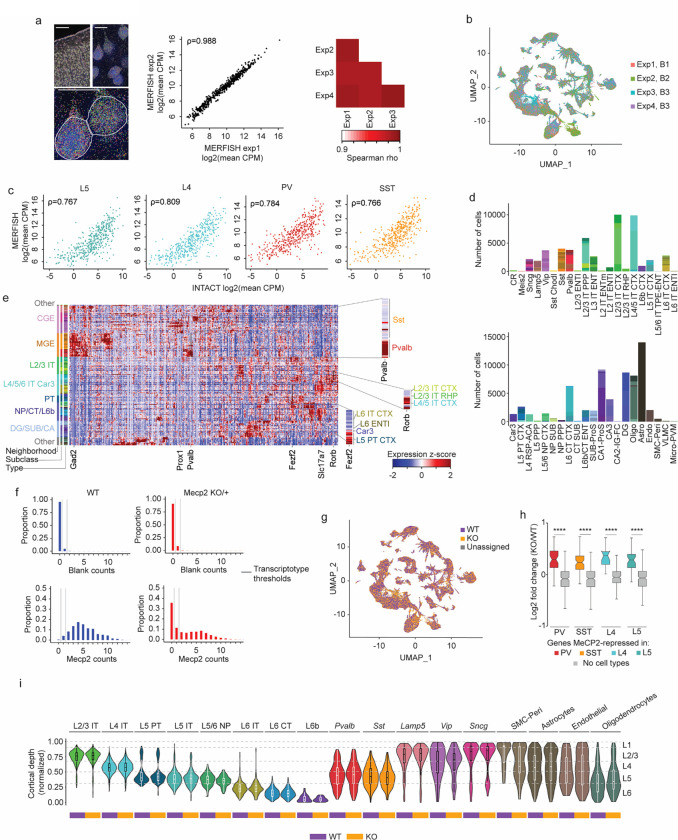
Extended Data Fig. 7. MERFISH analysis of cell types and MeCP2 expression in MeCP2 KO/+ brain shows expected gene expression and cell distributions across transcriptotypes.
a, Left: transcripts detected (colored dots) and DAPI images of MERFISH data in one experiment. Scale bar is 250 μm for low resolution view, and 25 μm for close-ups. Middle: correlation between experiments 1 and 2 in log2 mean CPM of each gene. Right: correlation between each pair of MERFISH experiments in log2 mean CPM of each gene. ρ = Spearman’s correlation coefficient. b, UMAP representation of cells in MeCP2 KO/+ MERFISH experiments, colored by experiment identity and biological replicate. B1–3=biological replicate 1–3. c, Scatter plot of log-transformed CPMs of gene expression in neuronal subclasses (PV, SST, L4, and L5) measured by INTACT RNA-seq and MERFISH. ρ = Spearman’s correlation coefficient. d, Number of cells of each type in each subclass in MeCP2 KO/+ MERFISH experiments. e. Heatmap showing z-scores of average expression for each gene in the MERFISH panel in each cell type. Inset: close-ups of Pvalb (PV marker gene), Fezf2 (L5 PT CTX marker gene), and Rorb (L4/5 IT CTX marker gene). f, Representative distributions of transcript counts per cell for Mecp2 and a representative negative control (“Blank counts”) detected in PV cells in MERFISH analysis of wild-type or MeCP2 KO/+ coronal sections. Cut offs used for calling “WT” and “KO” transcriptotypes in the MeCP2 KO/+ are shown. g, UMAP representation of cells identified as either WT, KO, or unassigned in MeCP2 KO/+ MERFISH experiments. h, MERFISH log2 fold-change of genes identified as MeCP2-repressed in PV, SST, L4, and L5 INTACT RNA-seq analyses. ****p < 0.0001 two-sided Wilcoxon rank-sum test. The center line of each boxplot is the median. Each box encloses the first and third quartile of the data. The whiskers extend to the most extreme values, excluding outliers which are outside 1.5 times the interquartile range. i, Locations of distinct sublcasses of WT and KO cells across cortical layers in the visual cortex identified using MERFISH. No major differences were observed in cortical depth between WT and KO cells. The center line of each boxplot is the median. Each box encloses the first and third quartile of the data.
n=3 biological replicates for MeCP2 KO/+ MERFISH across 4 imaged brain sections.

