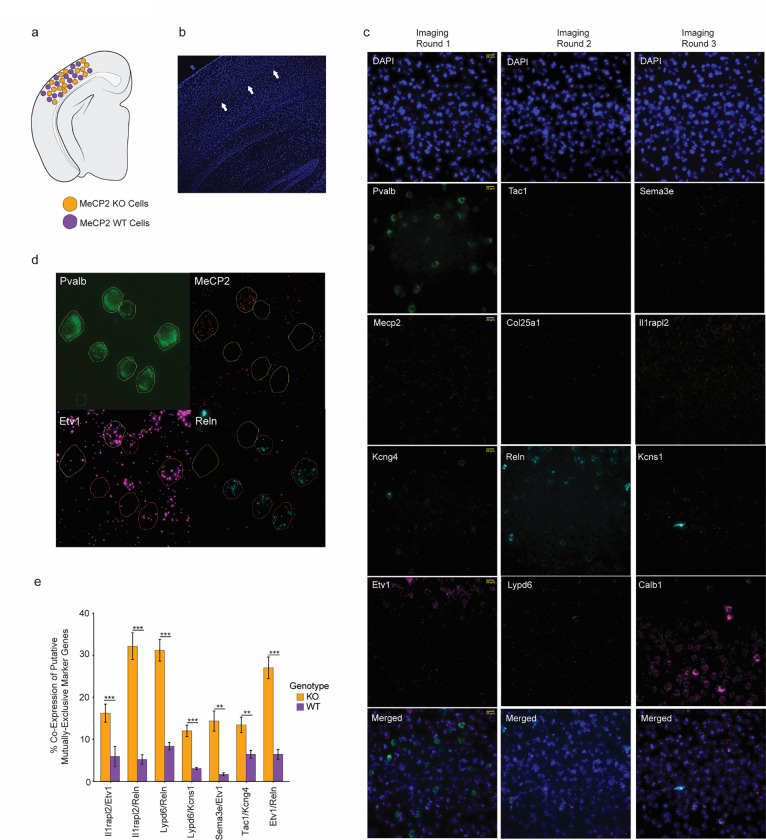
Extended Data Fig. 8. Loss of mutually exclusive type-specific gene expression in MeCP2 KO PV interneurons.
a, MeCP2 mutant heterozygous females contain wildtype and mutant cells. b, Representative image of visual cortex L4 area focused on for analysis. White arrow pointing to L4 region. c, Representative images from all 12 target probes and DAPI stain for each of the three imaging rounds. Merged images of each round shown. d, RNAScope analysis of expression of mutually exclusive marker genes for visual cortex PV interneurons in MeCP2 KO and WT PV neurons. Identification of PV neurons using Pvalb and call of MeCP2 KO and WT cells using Mecp2. e, Bar plots of rate of co-expression of putatively mutually exclusive PV marker genes in MeCP2 null and WT PV interneurons (n=3, 50–100 cells per experiment, two-sided unpaired t test, **p<0.01, ***p<0.005).
n=3 biological replicates for RNAScope.

