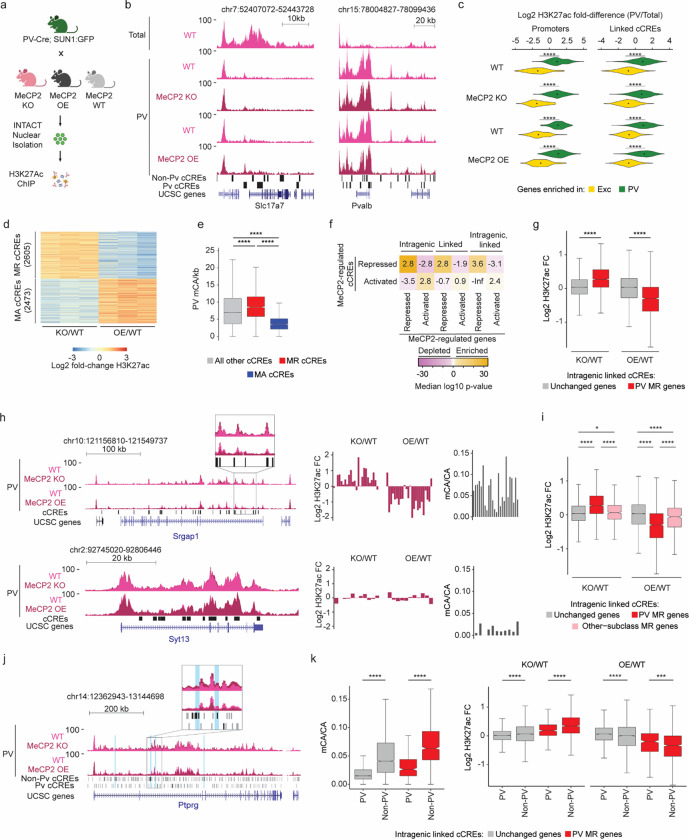
Fig. 3. Dysregulation of cell-type-specific high mCA enhancers in MeCP2 knockout parvalbumin positive interneurons.
a, Schematic of INTACT isolation and H3K27ac ChIP-seq profiling of PV MeCP2 wild-type (WT), MeCP2 knockout (KO), and MeCP2 overexpression (OE) neurons. b, Genome browser views of H3K27ac ChIP-seq signal in cortical (total) and PV nuclei at Slc7a7, a gene expressed in excitatory neurons, and Pvalb, a marker gene for PV neurons. Location of cCREs and genes shown at bottom. c, Log2 H3K27ac fold difference between PV and total nuclei for the same genetic background (MeCP2 WT, MeCP2 KO, or MeCP2 OE) at promoters and linked cCREs of the top 100 genes enriched for expression in PV neurons (log2 gene expression difference (PV/excitatory) > 0, PV RPKM >= 10, FDR-adjusted p-value <= 0.01, ordered by log2 fold difference) and the top 100 genes enriched in excitatory (Exc) neurons (log2 gene expression fold difference (excitatory/PV) > 0, Exc RPKM >= 10, FDR-adjusted p-value <= 0.01, ordered by log2 fold difference). The genes were identified from previous differential gene expression analysis of PV and excitatory genes52. ****p < 0.0001 two-sided Wilcoxon rank-sum test. Violin plots were made after excluding outliers which are outside 1.5 times the interquartile range of the data. d, H3K27ac fold-changes for cCREs identified as significantly dysregulated for H3K27ac ChIP-seq signal in PV neurons isolated from MeCP2 KO and MeCP2 OE mice (FDR-adjusted p-value ≤ 0.1). MR = MeCP2-repressed; MA= MeCP2-activated. e, Boxplot of PV mCA/kb in MeCP2-repressed (MR), MeCP2-activated (MA) and all other cCREs. ****p < 0.0001 two-sided Wilcoxon rank-sum test. f, Quantification of enrichment of MeCP2-regulated cCREs to be located inside (intragenic) or linked to MeCP2-regulated genes by co-correlation analysis42 or both. Median significance (log10 p-value from two-sided Fisher’s exact test, color) and enrichment (log2 odds ratio, number) are shown for cCREs associated with MeCP2-regulated genes compared to cCREs associated with expression-resampled genes. g, Log2 H3K27ac fold-change for cCREs located inside of, and linked to, PV MR genes or unchanged genes in PV MeCP2 KO and MeCP2 OE. ****p < 0.0001 Two-sided Wilcoxon rank-sum test. h, Left: overlaid PV MeCP2 WT, MePC2 KO, and MeCP2 OE H3K27ac ChIP-seq tracks in the PV MeCP2-repressed gene Srgap1 (top) and an other-cell-type MeCP2-repressed gene Syt13 (bottom). The inset shows cCRE-containing regions with changes in H3K27ac upon MeCP2 perturbation. Right: log2 H3K27ac fold-change PV MeCP2 KO and MeCP2 OE and PV mCA/CA of cCREs inside and linked to Srgap1 or Syt13. The expression of Syt13 is not affected in PV neurons and it does not show enrichment of mCA or alterations in histone acetylation at its associated cCREs. i, Log2 H3K27ac fold-change of cCREs inside and linked to PV MR genes, other-cell-type MR genes, or unchanged genes in PV MeCP2 KO and MeCP2 OE. *p < 0.05, ****p < 0.0001 Two-sided Wilcoxon rank-sum test. j, Genome browser view of H3K27ac ChIP-seq at the Ptprg gene in PV wild-type, MeCP2 KO, and MeCP2 OE. Gray bars are all cCREs while black bars are intragenic, cCREs linked to the gene. Inset shows region containing non-PV cCREs with changes in H3K27ac ChIP-seq signal in MeCP2 KO and MeCP2 OE relative to wild-type. Blue highlights are examples of non-PV cCREs called as significantly dysregulated upon MeCP2 perturbation. k, PV mCA/CA (left) and log2 H3K27ac fold-change in PV MeCP2 KO and MeCP2 OE (right) of PV and non-PV cCREs located inside of, and linked to, unchanged genes or PV MR genes. ***p < 0.001, ****p < 0.0001 two-sided Wilcoxon rank-sum test.
n=3 biological replicates for PV WT, MeCP2 KO, and MeCP2 OE H3K27ac ChIP-seq. n=2 biological replicates for Total WT, MeCP2 KO, and MeCP2 OE H3K27ac ChIP-seq. For all boxplots, the center line is the median. Each box encloses the first and third quartile of the data. The whiskers extend to the most extreme values, excluding outliers which are outside 1.5 times the interquartile range.

