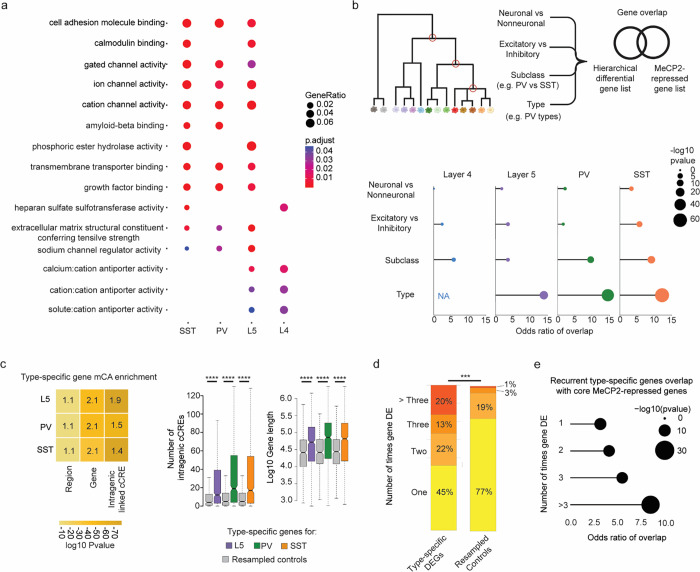
Fig. 4. MeCP2 regulates genes that are repeatedly tuned across closely related neuronal types.
a, Gene Ontology analysis of significantly dysregulated genes in each subclass from INTACT analysis shows enrichment for synaptic proteins, channels, and other factors important for neuronal cell type function. Top Molecular Function terms with overlap between cell types are shown. Gene ratio (percentage of total DEG in given GO term) and Benjamini-Hochberg adjusted p-value shown. b, Top: schematic of gene overlap analysis of MeCP2-repressed genes with gene sets distinguishing neuronal populations at different levels of hierarchical taxonomy previously generated from single cell transcriptomic data55. Bottom: odds ratio and significance of overlap between MeCP2-repressed genes identified in each neuron subclass and genes differentially expressed at each level of the hierarchy. P-value determined by two-sided Fisher’s exact test. NA shown for L4, because this subclass does not contain any defined types in the cellular taxonomy analyzed. c, Left, mCA enrichment analysis of regions, gene bodies, and intragenic-linked cCREs for genes that distinguish neuronal types within L5, PV, and SST subclasses. Enrichment relative to expression resampled control gene sets is shown numerically, significance is indicated by color. Right, quantification of number of intragenic enhancers and gene length for these neuron-type-specific genes. The center line of each boxplot is the median. Each box encloses the first and third quartile of the data. The whiskers extend to the most extreme values, excluding outliers which are outside 1.5 times the interquartile range. ****p < 0.0001 two-sided Wilcoxon rank-sum test d, Percentage of genes found to be differentially expressed between closely related neuron types in one or more pairwise comparisons of types within L5, PV, and SST subclasses. Values shown for true type-specific genes and for expression-matched, resampled control genes. e, Repeatedly tuned neuron type-specific genes significantly overlap with core MeCP2-repressed genes.

