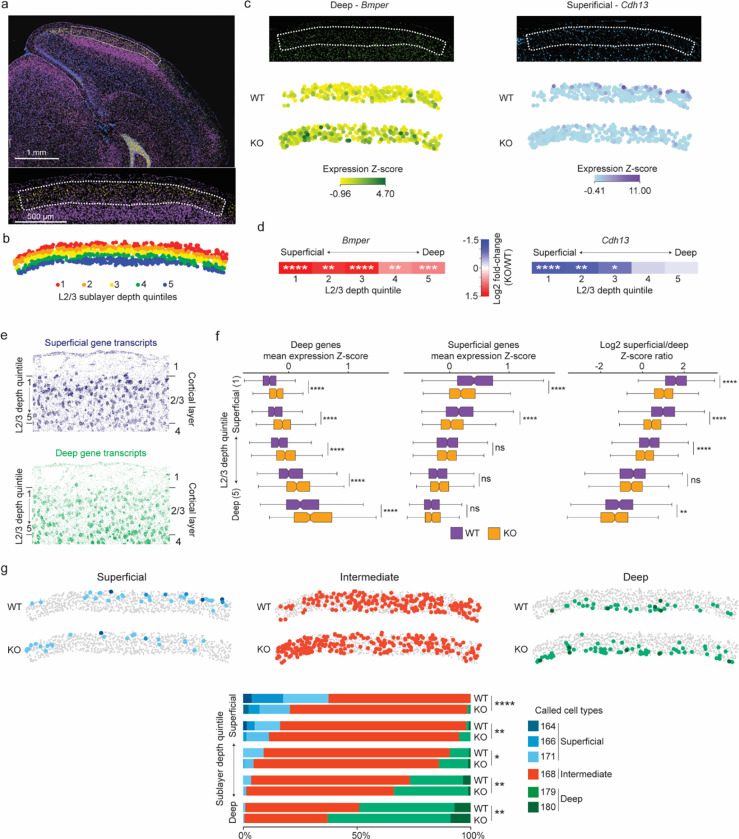
Fig. 6. Loss of MeCP2 disrupts sublayer-resolved gene programs in layer 2/3 of the visual cortex.
a, MERFISH image of a coronal section from an MeCP2 KO/+ brain (top) showing expression of the L2/3 marker Ccbe1 (yellow) and the L4 marker Rorb (purple); blue, DAPI. Dotted line demarcates L2/3 of primary visual cortex (V1) (bottom, higher magnification) selected for further analysis. b, Spatial map of excitatory neurons in L2/3 for a representative MeCP2 KO/+ V1 region where each cell is colored by the quintile of sublayer depth in which it resides. c, Examples of MERFISH signal and transcriptotype-resolved expression in WT vs. KO excitatory neurons in L2/3 of V1 for sublayer-specific genes detected as dysregulated in the MeCP2 KO cells. Top, MERFISH signal from an example MeCP2 KO/+ brain section. Bottom, expression from cells of each transcriptotype across all excitatory neurons in L2/3 of V1. Expression is reported as the z-score of SCTransform-corrected counts of the mRNA across glutamatergic cells in L2/3 of the visual cortex. d, Fold-change observed in MeCP2 KO vs. WT cells across superficial to deep sublayer depth quintiles for sublayer-specific genes examined in c. *p. < 0.05, **p < 0.01, ***p < 0.001, ****p < 0.0001, Benjamini-Hochberg corrected p-value from pseudobulkDGE analysis. e, Spatial map of RNA transcripts detected in L2/3 of the MeCP2 KO/+ V1 for gene sets previously3 proposed to be preferentially expressed in neurons located in the superficial sublayer (top, dark blue) or deep sublayer (bottom, green) f, Left, and middle: boxplots of mean expression z-score of genes previously associated with deep sublayers (left) and superficial sublayers (middle) in WT and MeCP2 KO cells across sublayer depth quintiles. Right: boxplots of ratio of mean expression z-score of superficial-sublayer-associated genes to mean expression z-score of deep-sublayer-associated genes, plotted by sublayer depth quintile. The center line of each boxplot is the median. Each box encloses the first and third quartile of the data. The whiskers extend to the most extreme values, excluding outliers which are outside 1.5 times the interquartile range. g, Top: spatial map of WT and KO excitatory neuron IT types detected in L2/3 of the MeCP2 KO/+ V1 separated by cell types associated with superficial, intermediate, or deep gene programs3 (see Extended data figure 9). Bottom: stacked barplots showing proportions of neuron types in sublayer depth quintiles of L2/3 of V1, separated by transcriptotype.
n=3 biological replicates for MeCP2 KO/+ MERFISH across 4 separate imaged brain sections.

