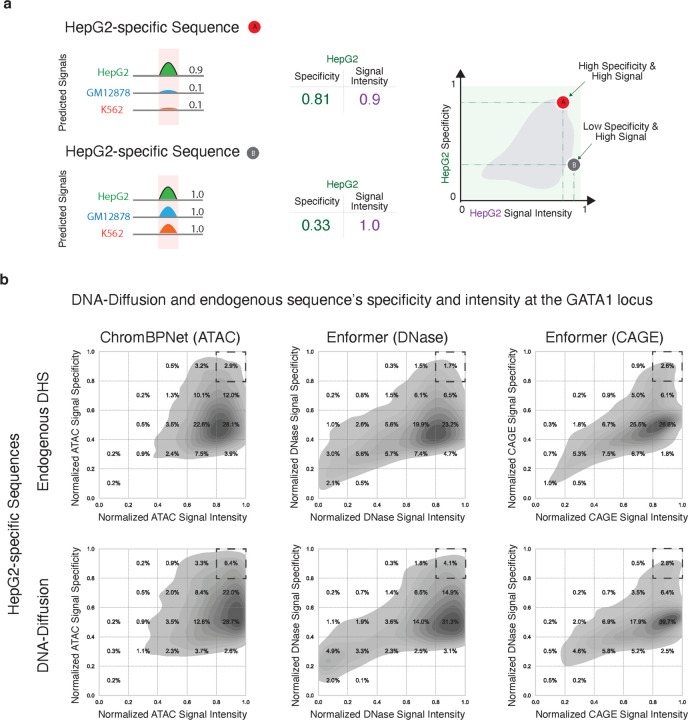
Figure 5.
a) Schematic illustrating the workflow for evaluating both signal intensity and target cell specificity of endogenous and DNA-Diffusion sequences. Shown are two hypothetical sequences: A, a strong signal present in only one cell line (HepG2), and B, a strong signal present in all the cell lines (GM12878, HepG2, K562) b) Density plots depicting the distribution of signal intensity and specificity for both endogenous train DHS and DNA-Diffusion sequences. Dashed squares highlight the upper right corner (high signal, high specificity) of each plot, indicating the region of interest for the selection of potent and cell type-specific regulatory sequences.

