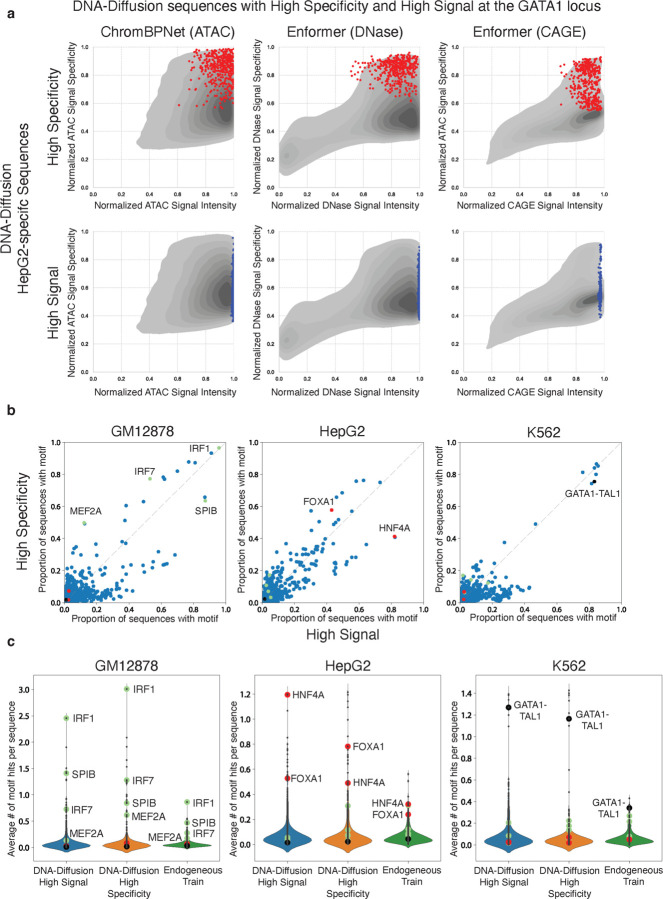
Figure 6. TF Motif Composition across High Signal and High Specificity DNA-Diffusion sequences.
a) Selection of 400 high specificity (red) and 400 high signal (blue) HepG2-specific DNA-Diffusion sequences based on the activities at the GATA1 locus. Points represent these two sets of sequences and are overlayed on the density plot of 100k HepG2-specific sequence. b) The normalized proportion of sequences containing specific TF motifs is shown for the high signal and high specificity sets. Green, red, and black TF motif points highlight TFs known to be active in GM12878, HepG2, and K562 cells, respectively. c) Violin plots depict the average number of TF motif hits per sequence across high signal, high specificity, and endogenous train sets. Green, red, and black TF motif points are marked for literature-backed TFs for GM12878, HepG2, and K562 cell lines, respectively.

