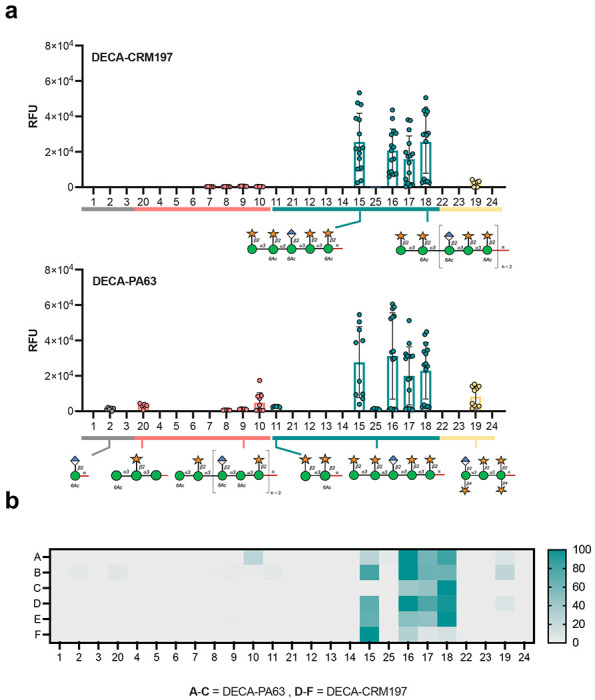
Figure 3. Microarray reactivity analysis of sera from mice immunized with CRM197 and PA63 glycoconjugates towards oligosaccharides.

A. Pooled response of DECA-CRM197 and DECA-PA63 mice b. A heatmap of comparing glycan binding profiles of sera from both conjugates. Rows A-C are DECA-PA63 and rows D-F are DECA-CRM197 mice. The heatmap is normalized by lowest and highest point in each dataset. The full library of the oligosaccharides structure can be found in SI Figure 5. A data point is the RFU of a single glycan spot on the array.
