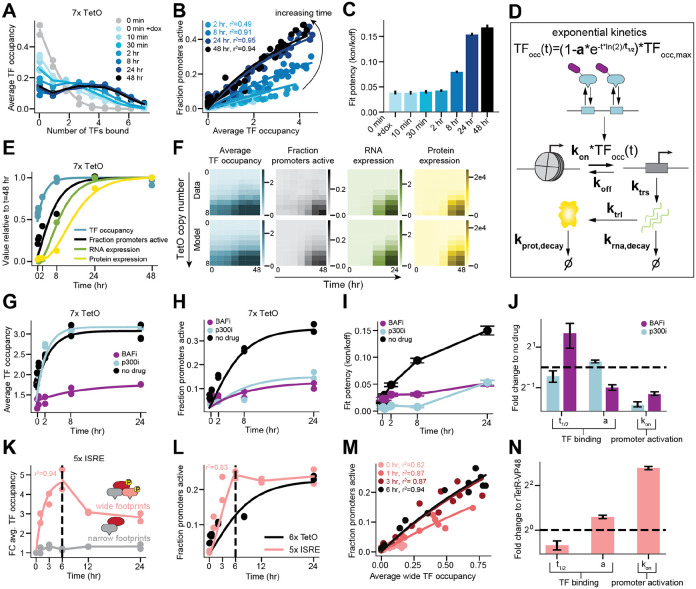
Figure 5: Kinetic modeling reveals timescales for chromatin and gene regulatory changes, as well as relative effects of cofactor inhibition and TF potency on activation.
A) The distribution of molecules with different numbers of rTetR-VP48s bound for a construct with 7 TetO binding sites for different times (after dox induction) and two biological replicates. The 0 minute sample (gray) is processed without dox present in buffers during the SMF assay (see Methods) whereas the 0 minute + dox (light blue) sample and all later timepoints are processed with dox present in buffers.
B) The relationship between average number of TetO sites bound by rTetR-VP48 and the fraction of promoters active for different times after dox induction and two biological replicates. Lines are Additive Activation model fits.
C) Potency () fit from Additive Activation Model across dox timecourse. Error bars are standard deviations.
D) A kinetic model for enhancer equilibration, promoter activation, transcription and translation.
E) Fits (lines, using kinetic scheme in D) on data (points) for average occupancy of rTetR-VP48, fraction active promoters, RNA expression, and MFI for a construct with 7 TetO binding sites over time. TF occupancy parameters: = 2.1 ± 0.3 hr and a = 0.52 ± 0.02. Promoter activation parameters: = 0.11 ± 0.02 TF−1 hr−1 and = 0.16 ± 0.04 hr−1. RNA parameters: = 2.0 ± 0.4 RNA (A.U.) hr−1 and = 0.20 ± 0.05 hr−1. Protein parameters: = 1,200 ± 200 protein (A.U.) RNA (A.U.)−1 hr−1 and = 0.16 ± 0.04 hr−1.
F) Measured data (top) and fit kinetic models (bottom, using kinetic scheme in D) for TF occupancy (r2 = 0.99), promoter activation (r2 = 0.90), RNA (r2 = 0.95), and protein levels (r2 = 0.92) over time and across TetO copy number.
G-H) Data and fits (using kinetic scheme in D) for TF occupancy (G) and fraction of active promoters (H) for the 7xTetO constructs over time under p300 inhibition (cyan) and BAF inhibition (purple) for two biological replicates.
I) Potency () fit from Additive Activation Model across dox timecourse with p300 (cyan) and BAF inhibition (purple). Error bars are standard deviations.
J) Kinetic parameters (using kinetic scheme in D) for data in G and H displayed as fold change compared to no drug conditions. Error bars are standard error.
K) Fold change of wide footprints (red) and narrow footprints (gray) for a construct with 5x ISRE elements as a function of time after stimulation with model fit up to six hours for two biological replicates.
L) Fraction of promoters active for a 5x ISRE enhancer (pink) plotted as a function of time after stimulation with model fit up to six hours for two biological replicates. For comparison to a TetO promoter with the same maximum fraction active, the fraction of promoters active for a 6xTetO enhancer (black) is plotted as a function of time after maximum dox stimulation with model fit for two biological replicates.
M) The relationship between average number of ISREs exhibiting a wide footprint and the fraction of promoters for different times after stimulation (up to 6 hours) and two biological replicates.
N) Kinetic parameters (using kinetic scheme in D) for data in K and L displayed as fold change compared to parameters obtained for rTetR-VP48. Error bars are standard error.

