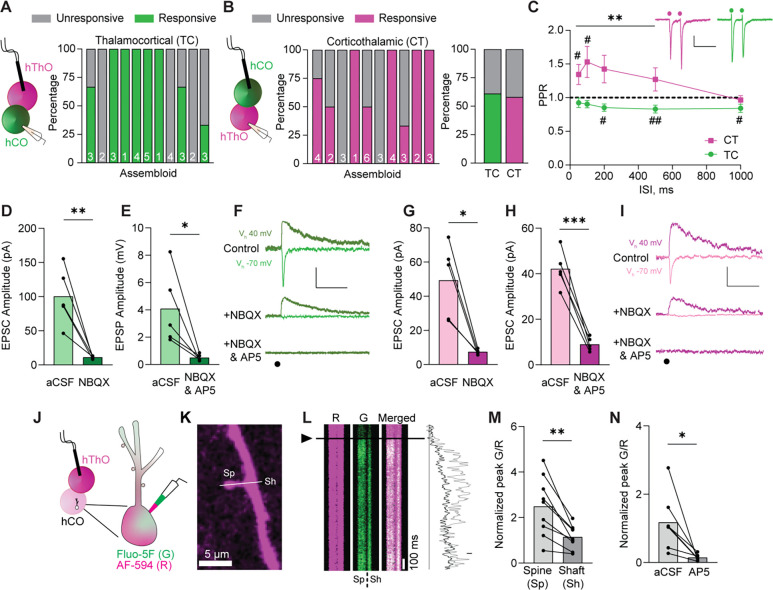
Figure 3. Assembloids contain glutamatergic TC and CT synapses.
(A) Left: Schematic of the recording configuration for the TC pathway. Right: Bar graph of the percentage of responsive (green) and unresponsive (gray) cells in 11 assembloids. The numbers of cells recorded per assembloid are shown in the bars.
(B) Left: Schematic of the recording configuration for the CT pathway. Middle: The percentages of hThO cells that responded (magenta) or did not respond (gray) to hCO stimulation across 10 assembloids. Right: Bar graph of the average percentage of responsive cells for TC and CT synapses, based on (A) and (B).
(C) Line graph of PPRs across five interstimulus intervals (ISIs) in CT (magenta) and TC (green) synapses [one-sample t-test: μ = 1, #p <0.05, ##p <0.01, n = 18–23 cells/9–13 assembloids (TC), n = 8–24/7–12 (CT)]. Differences between CT and TC synapses were evaluated by unpaired t-test (**p <0.01). Inset: Sample traces depicting PPRs in CT and TC synapses. Circles represent stimulus artifacts.
(D) Average TC EPSC amplitude [holding potential (Vh) −70 mV] in the presence of NBQX (3 μM) is significantly decreased compared to control aCSF conditions (paired t-test: **p = 0.009, n = 5 cells/2 assembloids).
(E) The average TC EPSP amplitude (Vh +40 mV) in the presence of NBQX and AP5 (50 μM) is significantly lower than in control aCSF (paired t-test: *p = 0.038, n = 5 cells/3 assembloids).
(F) Traces of evoked TC AMPAR- and NMDAR-mediated currents in control aCSF and in the presence of NBQX or NBQX and AP5, respectively. Circle represents the stimulus artifact.
(G) Average CT EPSC amplitude (Vh –70 mV) in the presence of NBQX is significantly decreased compared to control aCSF conditions (paired t-test: *p = 0.012, n = 5 cells/3 assembloids).
(H) The average CT EPSC amplitudes (Vh +40 mV) are significantly reduced in the presence of NBQX and AP5 compared to control aCSF (paired t-test: ***p = 0.0006, n = 5 cells/3 assembloids).
(I) Example traces of evoked CT AMPAR- and NMDAR-mediated currents in aCSF and in the presence of NBQX or NBQX and AP5, respectively.
(J) Schematics of two-photon calcium imaging in postsynaptic dendritic spines of hCO cells upon hThO stimulation. Alexa Fluor 594: AF-594 (R), magenta; Fluo-5F (G), green.
(K) Image of a dendrite of an hCO cell. Line scans (white line) were performed across a dendritic spine (Sp) and parent dendritic shaft (Sh).
(L) Left: Representative changes in G/R of Sp and Sh responses over time to a single synaptic stimulation (arrowhead and black line). Right: Representative line scans of Sp (light gray) and Sh (dark gray).
(M) Average changes in synaptically evoked G/R (paired t-test: **p = 0.002, n = 9 cells/4 assembloids).
(N) Average changes in synaptically evoked Sp G/R in aCSF and in the presence of AP5 (paired t-test: *p = 0.018, n = 7 cells/5 assembloids).
Data in (D), (E), (G), (H), (M), and (N) are shown as the mean values with individual responses overlaid. Grouped data (C) are shown as mean ± SEM. Scale bars (C): 20 pA, 200 ms. Scale bars (F), (I): 40 pA, 100 ms. Scale bar (L): 20% G/R.
See Figure S7 for snRNA-seq data supporting glutamatergic communication between hThO and hCOs.

