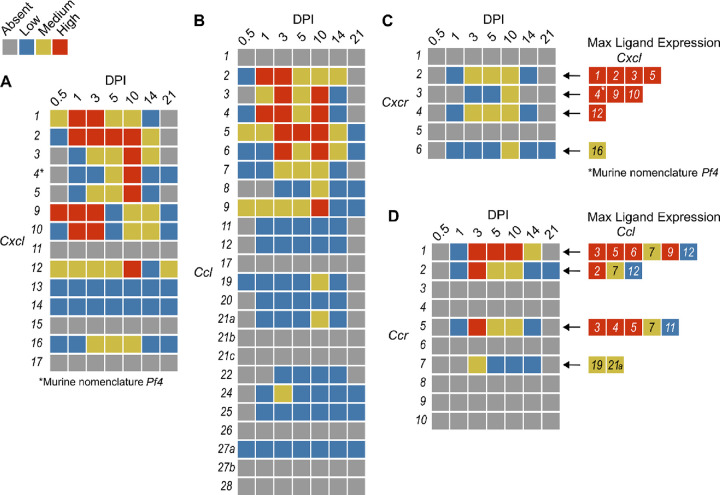
Figure 4. Qualitative heatmaps of chemokine and receptor expression during infection.
Normalized expression in SpatialFeaturePlots was visually ranked as absent (grey), low (blue), medium (yellow), or high (red) for (A) CXCL family chemokines, (B) CCL family chemokines, (C) CXC chemokine receptors, and (D) CC chemokine receptors. Visual rankings were based on both the intensity of expression and the relative number of spots that expressed the gene. (A-B) Scale set at 0 – 3.0 expression; (C-D) Scale set at 0 – 2.0 expression. Arrows indicate Ligand – Receptor interactions. Ligands are color-coded based on the maximum expression level reached at any time during the course of infection.

