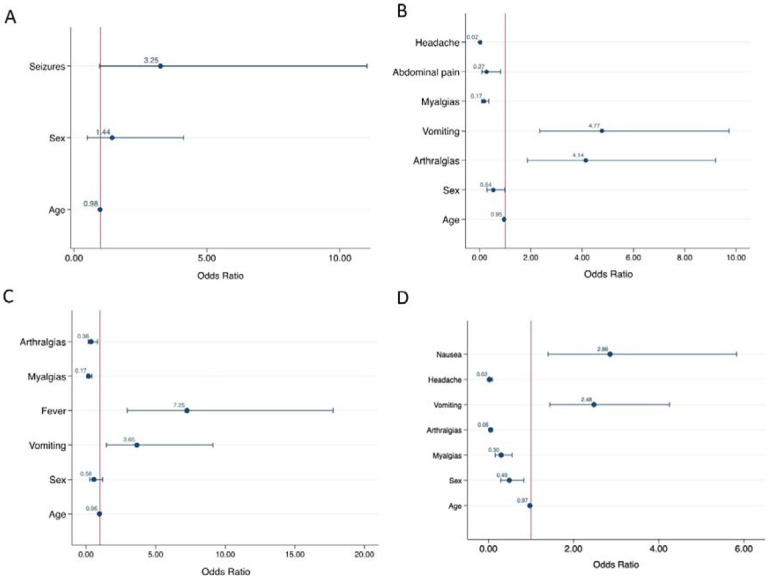
Figure 7. Multivariable logistic regression analysis of associated symptoms of A) MADV vs VEEV infection, and combined encephalitic alphavirus infection versus, B) DENV infection, C) ZIKV infection and D) CHIKV infection.
The red vertical line represented number 1, an odds ratio of 1 indicates that the odds of the event are the same in both groups.

