
Figure 3: Animal models of DENND5A-DEE exhibit common phenotypes observed in the human cohort.
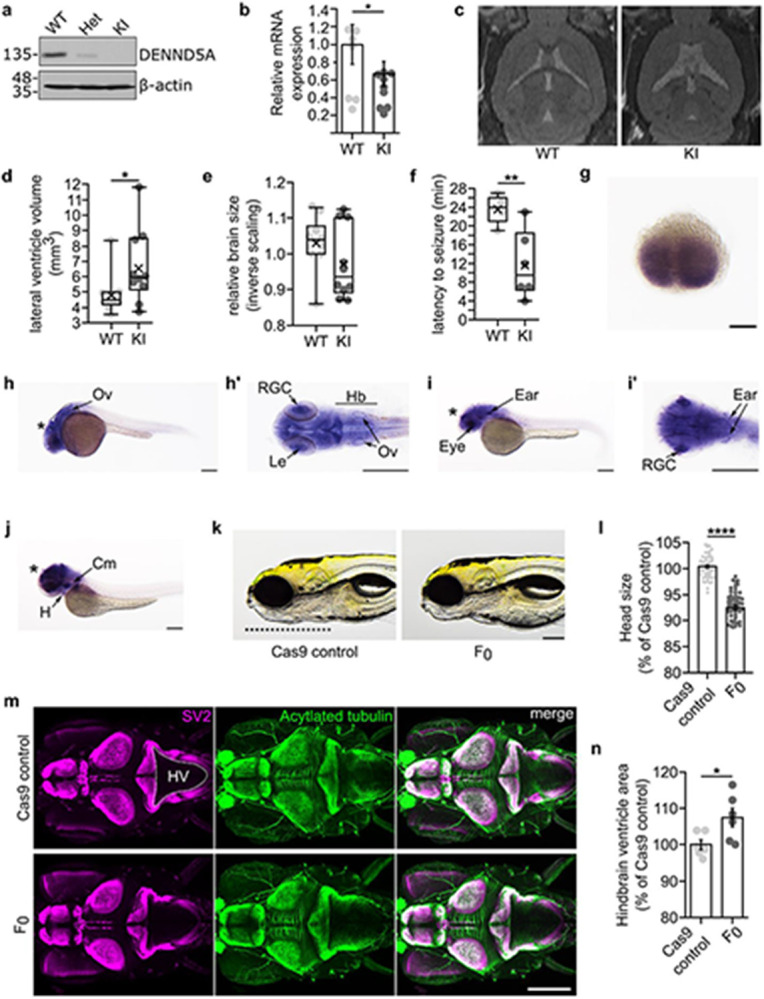
a, Mice heterozygous (Het) for p.D173Pfs*8 express full-length DENND5A protein at half the levels compared to WT mice and homozygous knock-in (KI) mice express no full-length DENND5A protein. b, Relative brain DENND5A mRNA levels measured via RT-qPCR from n = 6 total mice. Experiments were performed in triplicate in 3 independent experiments. Error bars = SEM. c, Sample images of WT and KI in vivo 7T MRIs. d, Quantification of pooled lateral ventricle volumes obtained through segmenting n = 10 mouse MRIs. Each dot represents one animal. X = mean. e, Quantification of relative brain volumes measured using MRI data from n = 10 mice (MWT = 1.03, MdnWT = 1.04, MKI = 0.97, MdnKI = 0.94, SDWT = 0.08, SDKI = 0.10, two-tailed Mann-Whitney U, Z = −1.361, p = .174). Each dot represents one animal. X = mean. f, Quantification of seizure latency after injection of 4-AP. Multiple independent experiments were performed with a total of n = 5 WT and n = 6 KI mice. Each dot represents one animal. X = mean. (g-j) Whole-mount in situ hybridization shows dennd5a mRNA expression at g, 0.75 hpf, h, 24 hpf, i, 48 hpf and j, 72 hpf. Asterisks = brain; Ov = otic vesicle; Le = lens; RGC = retinal ganglion cells; Hb = hindbrain; H = heart; Cm = cephalic musculature. Scale bar = 0.2 mm. k, Sample images of control and F0 KO zebrafish head size. Dotted line marks the length of the head used in quantification. Scale bar = 0.2 mm. l, Quantification of head size in n = 60 larvae analyzed via two-tailed Mann-Whitney U test (MedControl = 100.432, MedF0 = 93.073, SDControl = 2.316, SDF0 = 3.728; Z = −9.206, p < .0001). Each dot represents one larva. Data are mean ± SEM. m, Representative image of larva at 6 dpf immunostained with anti-SV2 (magenta) and anti-acetylated tubulin (green). Dorsal view, anterior to the left. HV = hindbrain ventricle. Dotted line outlines hindbrain ventricle area used in quantification. N, Quantification of hindbrain ventricle area in n = 6 larvae analyzed via two-tailed student’s t-test (MControl = 100, MF0 = 107.502, SDControl = 3.251, SDF0 = 6.386; t(10) = −2.564, p = 0.028). Data are mean ± SEM. Each dot represents one larva.