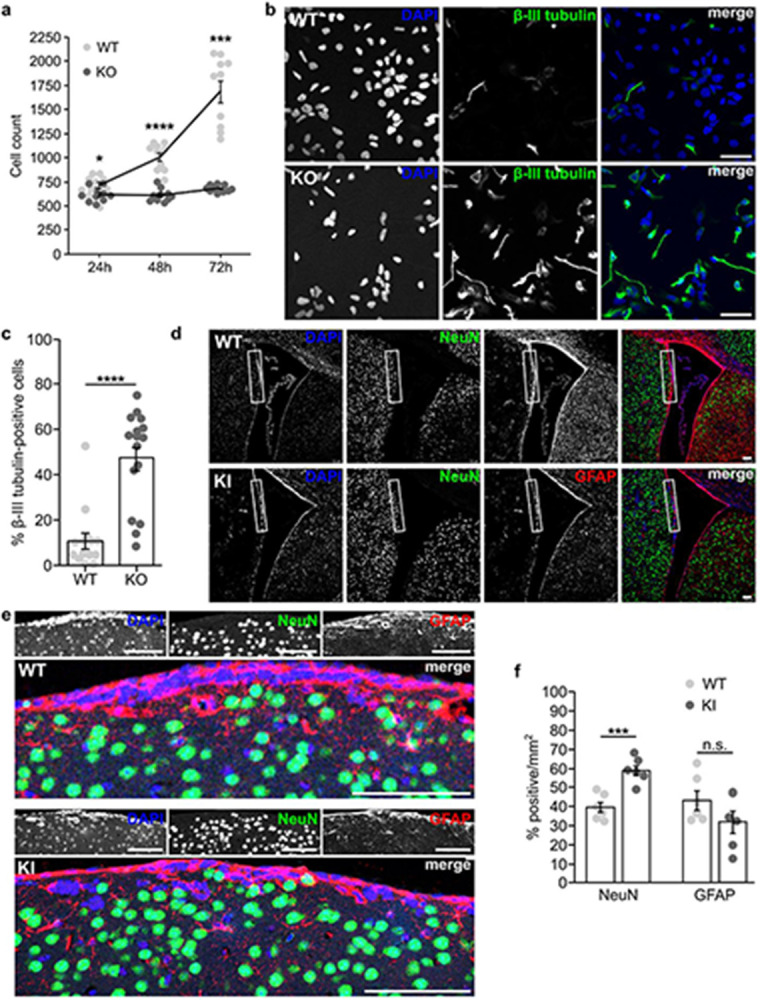
Figure 5: Loss of DENND5A results in premature neuronal differentiation.

a, Graph showing the average number of NPCs counted per well of a 96-well plate 24, 48, and 72 hours after plating equal numbers of cells. Data are derived from 10 technical replicates from n = 2 independent experiments. Each dot represents the number of cells counted in one well. Error bars = SEM. b, Immunostaining of β-III tubulin (green) and DAPI (blue) in NPCs one day after plating into neural progenitor maintenance medium. Scale bar = 50 μm. c, Quantification of the percent of β-III tubulin-positive cells per field. A total of n = 2267 cells were analyzed from three independent experiments. Each dot represents the percentage calculated from one image. Data are means ± SEM. d, Immunostaining of GFAP (red), NeuN (green), and DAPI (blue) in the SVZ of adult mice. Scale bar = 100 μm. e, Close-up of the regions indicated in the insets in (d). f, Quantification of the percentage of cells per mm2 labeled by NeuN or GFAP from a total of n = 4 mice. Each dot represents the percentage calculated from one image. Data are mean ± SEM.
