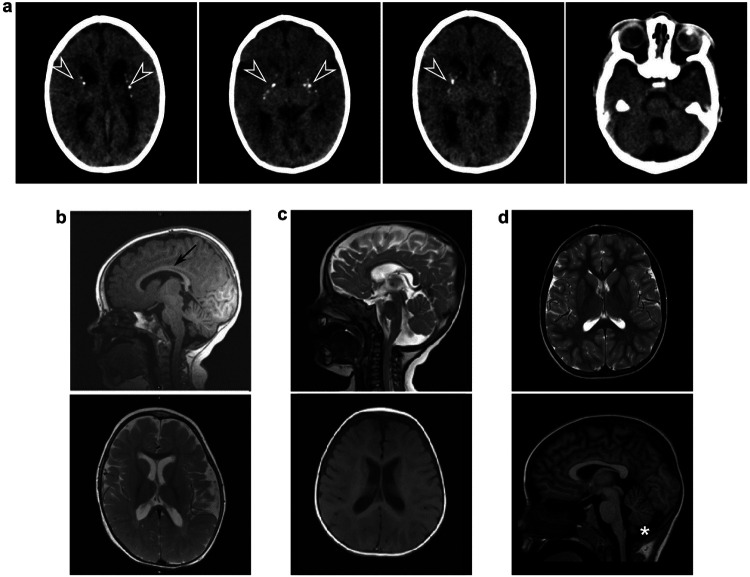
Extended Data Figure 2: Neuroimaging of other cases with DENND5A-related DEE show varying levels of phenotypic overlap.
a, CT from a homozygous individual with the variant p.V1202Afs*52 (participant 25) shows mild cortical volume loss, ventriculomegaly, thin corpus callosum, and lenticulostriate and periventricular calcifications (arrowheads). b, MRI from a compound heterozygous individual with variants c.950-20_950-17delTTTT/p.R1078Q (participant 9) shows mild corpus callosum volume loss (arrow). c, MRI from a compound heterozygous individual with variants p.R1032T/p.T1039N (participant 30) shows enlarged lateral ventricles. d, MRI from a compound heterozygous individual with variants p.K485E/p.R1159W (participant 8) shows a normal MRI with mild inferior cerebellar vermis hypoplasia (asterisk).

