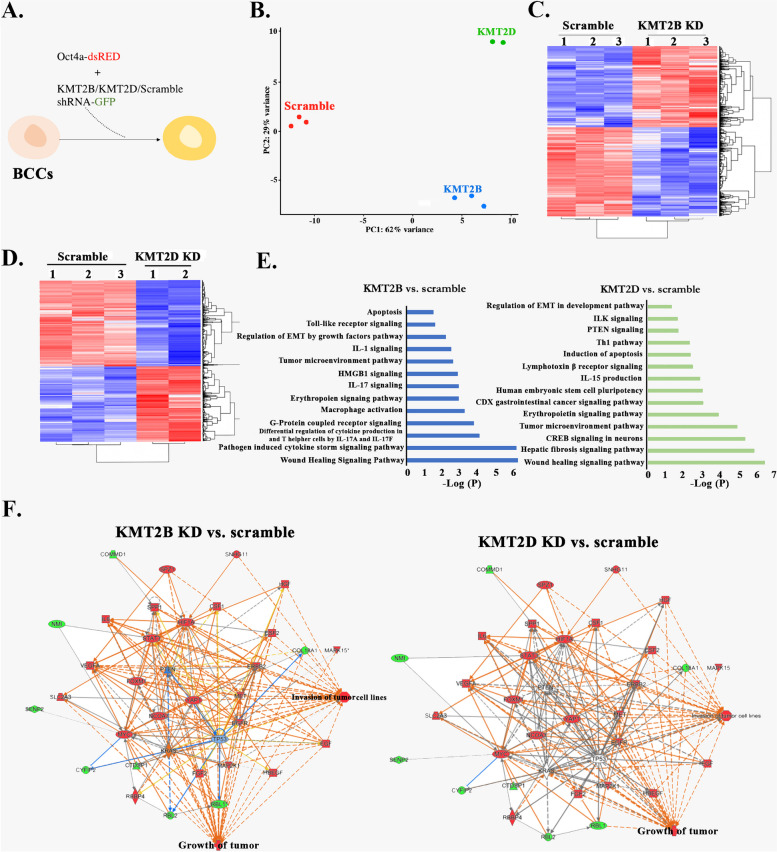
Fig. 2.
RNA-Seq analyses of KMT2B and KMT2D KD BCCs. A Shown is the experimental design in which MDA-MB-231 and T47D expressing Oct4a-dsRed were transduced with KMT2D-GFP tagged shRNA at MOI of 1:50,000. B Principal component analysis (PCA) of the different groups of cells that were subjected to RNA-Seq. The plot was established with normalized data (C & D) Heatmaps of the normalized genes are shown for scramble shRNA and depicting expression differences between scramble and KMT2B (C) or KMT2D KD BCCs. E Gene ontology showing canonical pathways upregulated in KMT2B and KMT2D KD BCCs. F Genes selected by IPA with functional link to the tumor growth pathway are shown in KMT2B and KNT2D knockdown BCCs. Network show activation of the growth of tumor pathway in botb KD BCCs

