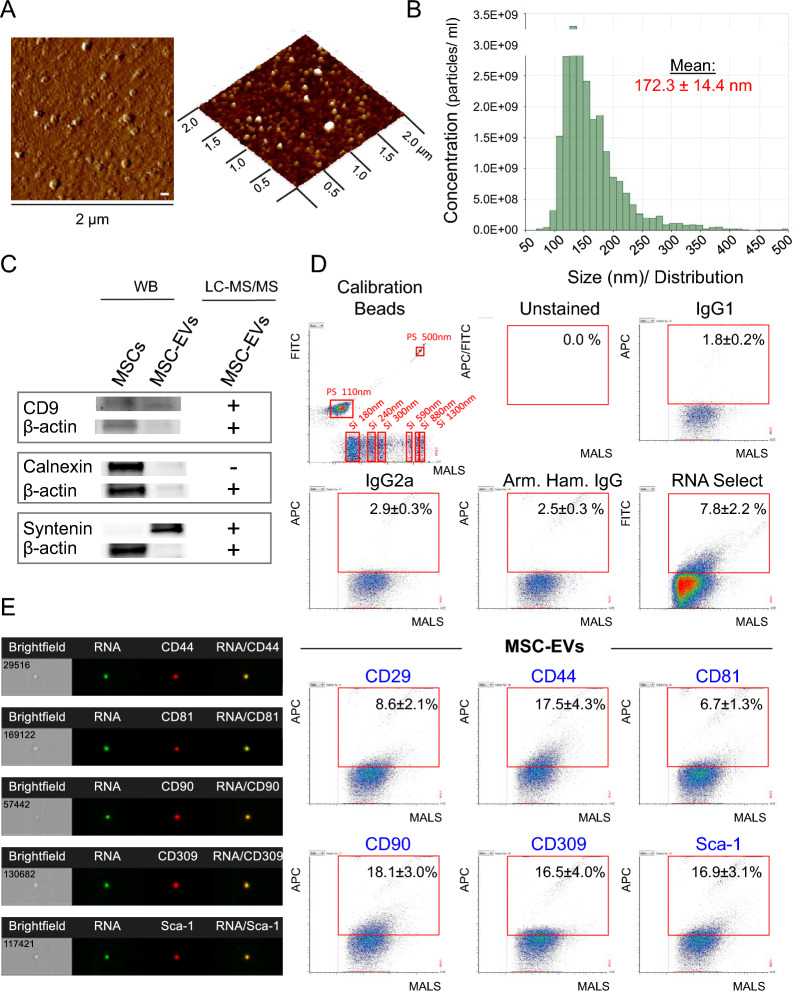
Fig. 1.
Characterization of MSC-EVs. A Representative images of MSC-EVs (left) and their 3D topography (right) by atomic force microscopy (AFM). Size of the scan 2 µm. Scale bar = 1.00 nm. B Representative histogram of particles size distribution in MSC-EVs specimen by IZON qNano. C Representative Western immunoblot confirming the presence of typical EVs markers (CD9 and syntenin) and lack of expression of endoplasmic reticulum protein-calnexin in MSC-EVs when compare to MSCs confirmed by mass spectrometry results (LC–MS/MS). D High-resolution flow cytometry analysis of MSC-EVs. (Top) Histogram showing the size distribution of mixed size synthetic beads (PS, fluorescently labeled polystyrene calibration beads detected in FITC channel; and Si, unlabeled silicone calibration beads) and representative histograms from analysis of control samples (unstained, isotype controls and labeled with RNA Select). (Bottom) Representative dot plots showing the medium-angle light scatter (MALS) related to EV size vs. fluorescence intensity indicating expression of selected EV-specific markers (CD81), MSC-specific antigens (CD29, CD44, CD90, Sca-1) antigens and VEGFR3 (CD309) on RNA-enriched MSC-EVs. E Analysis of selected markers on MSC-EVs by imaging cytometry

