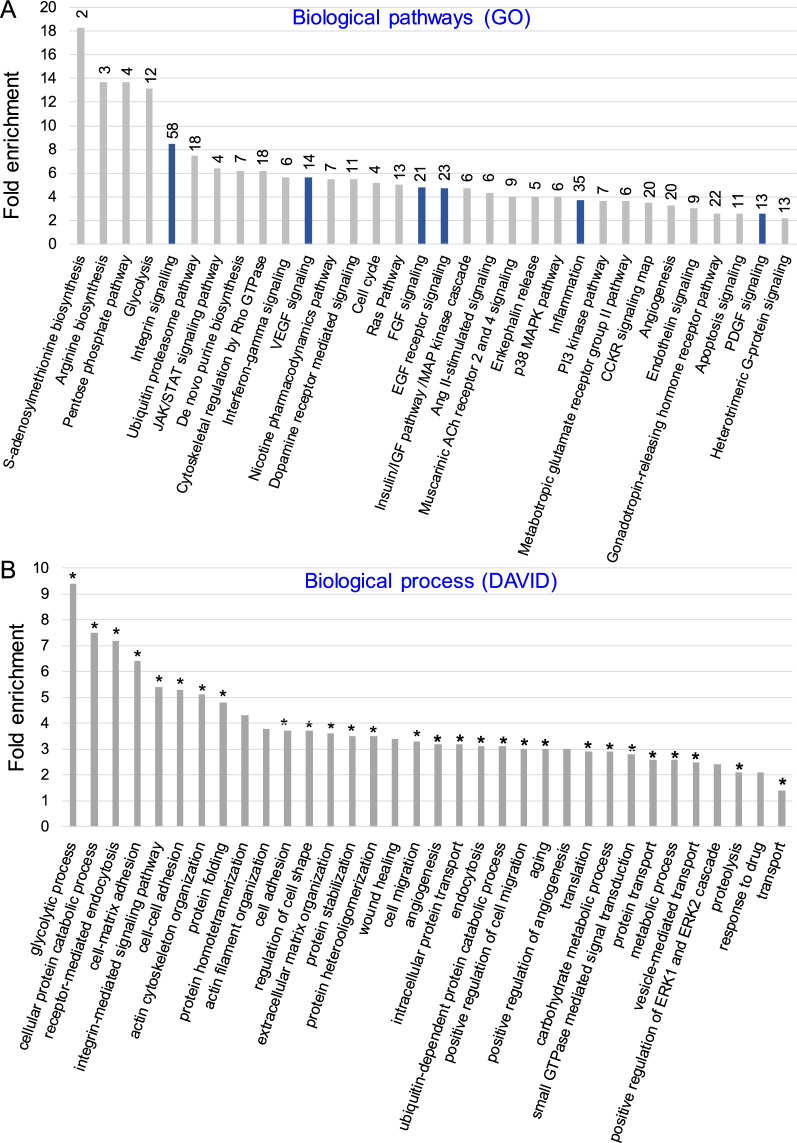
Fig. 2.
Global MSC-EV protein content and its role in biological processes and pathways. A Gene Ontology (GO) analysis. Panther pathway overrepresentation analysis of proteins identified in at least 2 out of 3 MSC-EV samples based on 2 or more unique peptides identified for every protein by LC–MS/MS. The results were displayed as fold enrichment of identified proteins in specific biological pathways. Total number of MSC-EV proteins identified for every pathway is presented over every bar. The navy bars represent regeneration-related pathways. Test type: Fisher’s Exact, Correction: FDR; P < 0.05, FDR < 0.05. B DAVID functional annotation bioinformatics microarray analysis. The analysis was conducted exclusively for proteins identified in at least 2 out of 3 MSC-EV samples based on 2 or more unique peptides. On the graph were displayed the most significant groups of proteins containing at least 20 proteins in terms. P < 0.05, Benjamini test < 0.05, Fisher Exact test < 0.05, (*) FDR < 0.05

