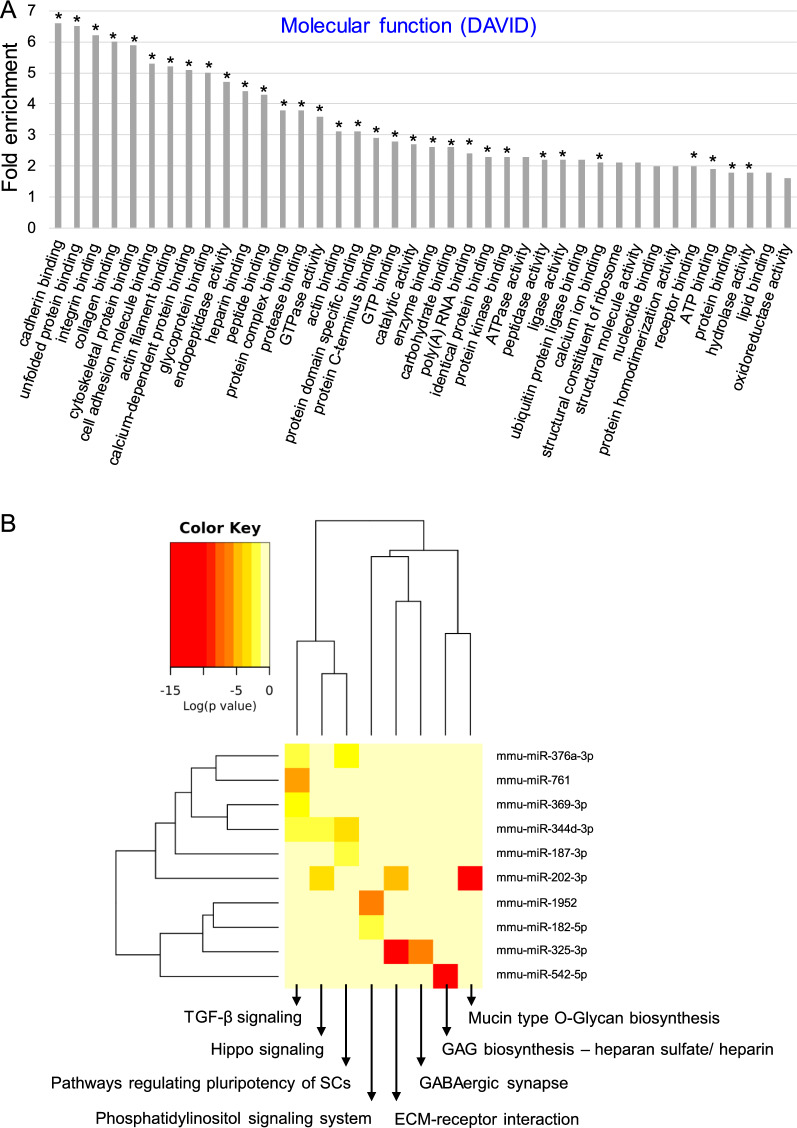
Fig. 3.
Molecular functions of proteins and microRNAs present in MSC-EVs. A Analysis of global proteomic content of MSC-EVs with focus on molecular functions by DAVID functional annotation bioinformatics microarray analysis. The analysis was conducted on proteins which were identified at least in 2 out of 3 MSC-EV samples based on 2 or more unique peptides. On the graph were displayed the most significant groups of proteins containing at least 20 proteins in terms. P < 0.05, Benjamini test < 0.05, Fisher Exact test < 0.05, (*) FDR < 0.05. B Heat-map generated with DIANA mirPath web tool showing functional pathways insertion for the most enriched miRNAs in MSC-EVs when compared to parental MSCs (fold change in expression ≥ 2.0). The attached dendrograms show hierarchical clustering results for miRNAs (Y-axis) and pathways (X-axis). Red squares indicate lower P values (more significant) and higher interaction of each miRNA with specific molecular pathway. P < 0.05

