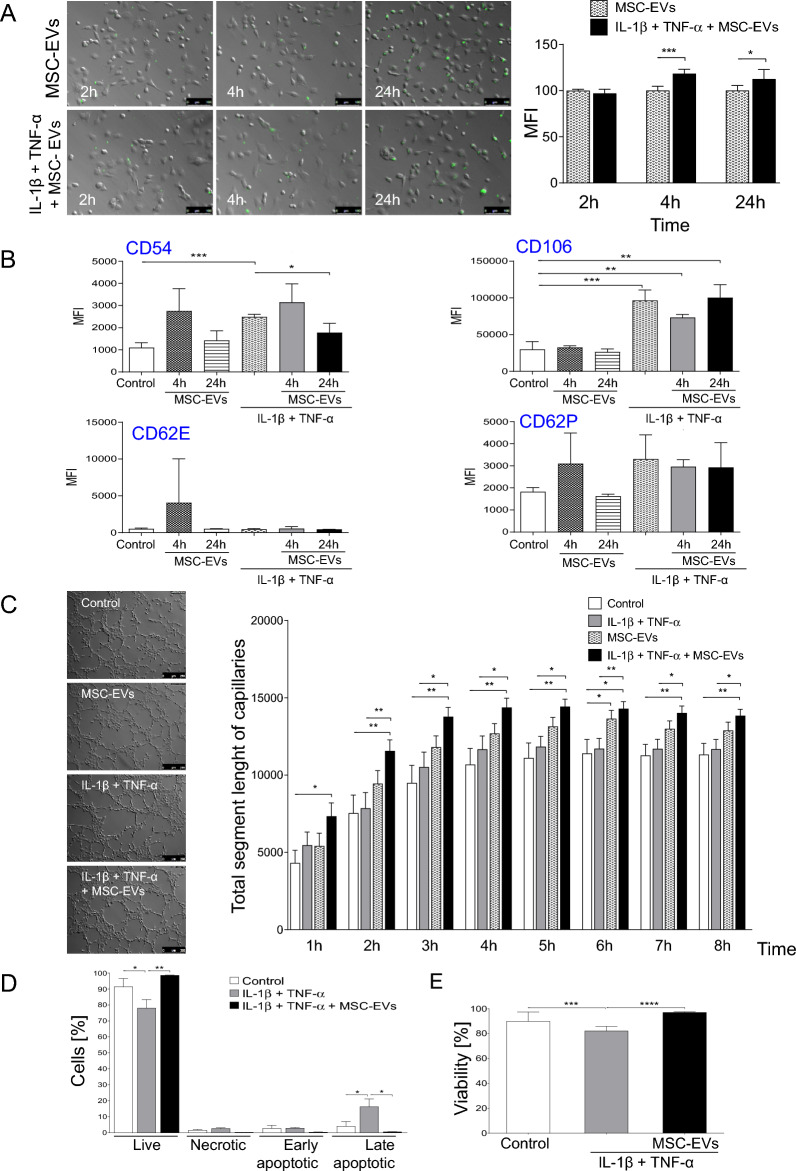
Fig. 4.
Functional effects of MSC-EVs on ECs in vitro. A Cellular up-take of MSC-EVs by untreated (control) or IL-1β and TNF-α pre-incubated MCECs by fluorescent microscopy. MSC-EVs were fluorescently labelled with DIO (green) and incubated with cells for 2, 4 or 24 h. (Left) Representative images of MCECs incubated with MSC-EVs. (Right) Mean fluorescence intensity (MFI) of MCECs incubated with MSC-EVs measured at different time points and analyzed by ImageJ software. Scale bar = 100 µm. B Expression of selected endothelial cell activation markers (CD54, CD106, CD62E, CD62P) on MCECs: untreated cells (Control), pre-incubated with IL-1β, TNF-α and/or treated with MSC-EVs for 4 h or 24 h, measured by flow cytometry. C (Left) Proangiogenic potential of MCECs: untreated (control), IL-1β and TNF-α-treated, MSC-EV-treated or IL-1β, TNF-α and MSC-EV-treated MCECs on Matrigel matrix. Scale bar represents 250 µm. (Right) Quantitative analysis of pro-angiogenic potential of MCECs presented as total segment length of capillaries per microscopic field at different time points (from 1 h until 8 h). D Viability of MCECs treated or untreated with MSC-EVs and cultured in microenvironment mimicking ischemic injury conditions by flow cytometry. MCECs were cultured in the presence of IL-1β and TNF-α under hypoxic conditions (2% O2). Percent content of alive (AnnV−/PI−), necrotic (AnnV−/PI+), early apoptotic (AnnV+/PI−) and late apoptotic (AnnV+/PI+) cells at 4 h post MSC-EVs were shown. E Viability of MCECs stained with DAPI by flow cytometry. Student t-test, comparison with untreated control cells (*P < 0.05, **P < 0.01, ***P < 0.001, ****P < 0.0001)

