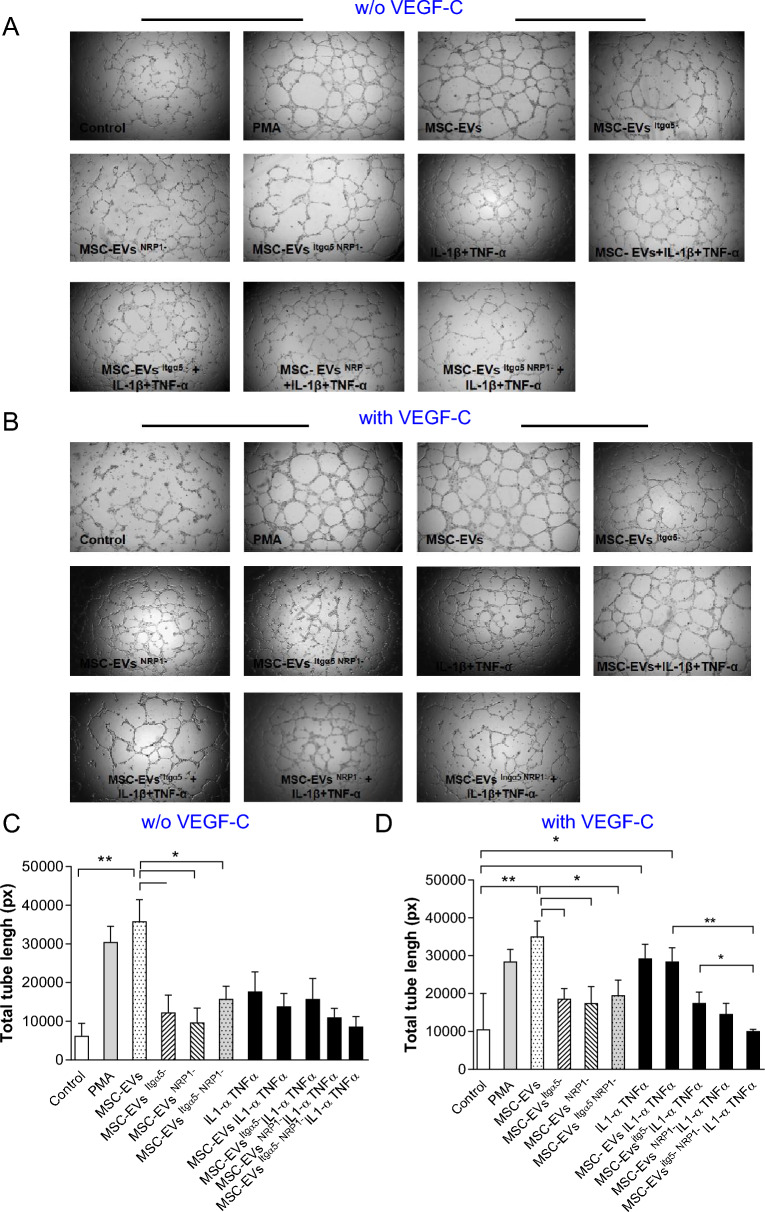
Fig. 5.
Effects of MSC-EVs on lymphatic ECs in vitro. Representative phase contrast photographs of LECs incubated A or unincubated with VEGF-C B and with/without MSC-EVs: native/unmodified (MSC-EVs), EVs pre-incubated with NRP1 antibody (MSC-EVsNRP1−) or EVs pre-incubated with Itgα5 antibody (MSC-EVsItgα5−). LECs treated with PMA represent positive control. Bar graph represent the quantitative analysis of total tube length formed by LECs in absence C and in the presence D of VEGF-C. Student t-test, comparison with untreated control cells (*P < 0.05, **P < 0.01)

