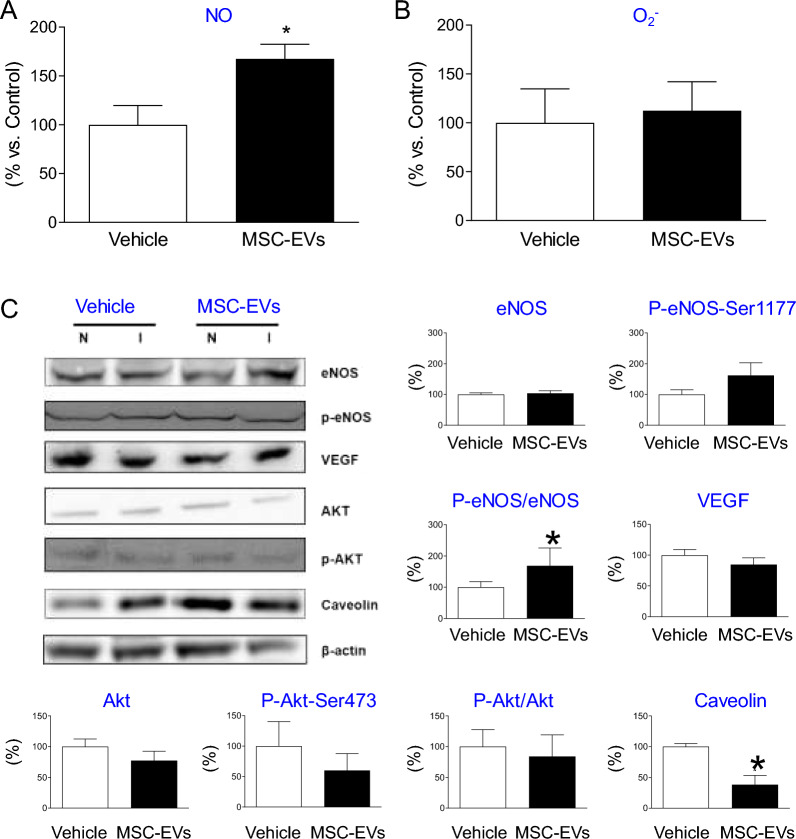
Fig. 7.
Activation of angiogenesis related pathways in skeletal muscles after MSC-EV treatment in vivo. Quantification of NO A and O2− B production in skeletal muscles by EPR. C (Left) Representative Western immunoblotting analysis of protein levels of eNOS, VEGF, Akt and their phosphorylated variants, caveolin and β-actin proteins in muscle tissues from ischemic (I) and non-ischemic (N) limb. (Right/Bottom) Quantitative analysis of expression and phosphorylation of eNOS, VEGF, Akt and caveolin-1. Values are presented as a ratio of ischemic (I) to non-ischemic (N) signal amplitude/protein expression and calculated as a percent (%) of signal in control tissues form vehicle (PBS)-treated animals. Mann–Whitney test, comparison to vehicle-treated samples (*P < 0.05)

