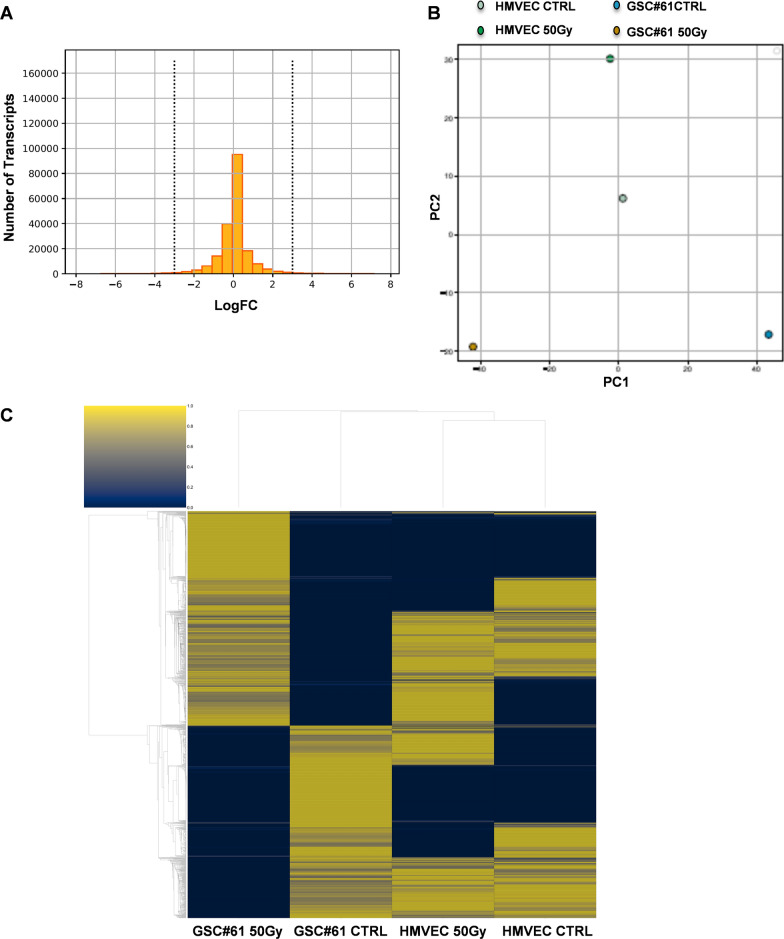
Fig. 3.
RNA-Seq of EV content and differential gene expression analysis. A. Histogram of the log fold change (logFC) of the genes. Vertical lines represent the upper and lower limits chosen as the fold change threshold. B. PCA applied to the cell lines from which EVs were isolated. Each cell line is seen as a function of its gene expression, that is, as a function of the genes whose number was skimmed in the previous step. C. Hierarchical clustering of gene expression. Cell lines from which EVs were isolated are represented on the columns, the genes on the lines. The data are normalized on line allowing the comparison of the expression of each gene in the various EVs

