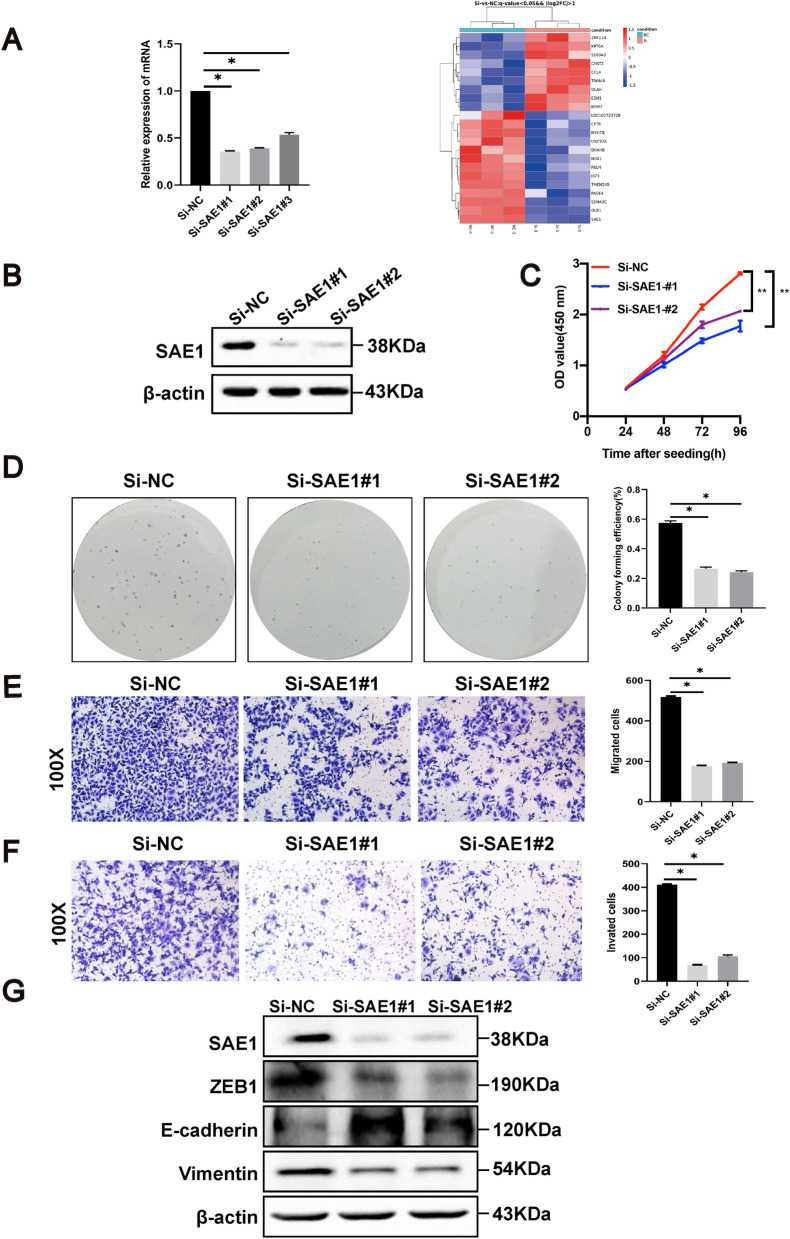
Fig. 2.
| SAE1 promotes proliferation, migration, and invasion of GC cells. A The heat map that showed the top 22 DEGs (differentially expressed genes) from analysis of RNA sequencing data in AGS cells with SAE1 knockdown and control group. B Western blot analysis of β-actin and SAE1 in AGS cells treated with negative control (Si-NC), SAE1 siRNA#1 (Si-SAE1#1), SAE1 siRNA#2 (Si-SAE1#2), and SAE1 siRNA#3 (Si-SAE1#3). The data is representative of 3 independent experiments. C CCK8 assays were conducted in AGS cells with Si-NC, Si-SAE1#1, and Si-SAE1#2, relative cell proliferation rate was represented as the OD value at a wavelength of 450 nm and was summarized in the statistical graph. The data is representative of 3 independent experiments. * p < 0.05, **p < 0.01. D Colony forming assays were conducted in AGS cells with Si-NC, Si-SAE1#1, and Si-SAE1#2, the colony forming efficiency was counted and summarized in the statistical graph. The data is representative of 3 independent experiments. * p < 0.05. E The migration assays were conducted in AGS cells with Si-NC, Si-SAE1#1, and Si-SAE1#2, positively stained cells were counted and summarized in the statistical graph. Original magnification, × 100. The data is representative of 3 independent experiments. * p < 0.05. F The invasion assays were conducted in AGS cells with Si-NC, Si-SAE1#1, and Si-SAE1#2, positively stained cells were counted and summarized in the statistical graph. Original magnification, × 100. The data is representative of 3 independent experiments. * p < 0.05. G Western blot analysis of β-actin, SAE1, Vimentin, E-cadherin, and ZEB1 in AGS cells with Si-NC, Si-SAE1#1, and Si-SAE1#2 treatment. The data is representative of 3 independent experiments

